Insights from the CDH Benchmark Survey: How Are Teams Adopting Discovery Habits?

“Product thought leaders talk about an ideal way of working. Nobody actually works that way.”

I can’t tell you how many times I hear this sentiment on Twitter and LinkedIn. And I hate it.

I realize that many product people have never worked in a product trio, don’t have access to customers, aren’t given time to test their ideas, and are working in what Marty Cagan calls “features teams” or “delivery teams.”

And just the same, many people do work in product trios, interview customers, test their ideas, and work on empowered product teams.

Both are true. The reason why it’s so hard for the first group to believe that the second group exists is because they’ve never seen it.

But just because you’ve never seen it or experienced it, that doesn’t mean it doesn’t exist. Especially when your experience only spans a half a dozen or so different workplaces.

To help highlight that real teams do work this way, we ran our inaugural CDH Benchmark Survey this past fall, where we asked teams about their discovery habits.

This is the second post about this survey. If you missed the first one on product success and team satisfaction, be sure to start there. It covers who we talked to, how we found them, and explained the goals of the survey. This post will pick up where it left off.

Shifting From Outputs to Outcomes

Good discovery starts with a clear outcome. Your outcome sets the scope for your discovery. It keeps us focused and ensures that we create value for the business while meeting customer needs.

We asked teams about their habits related to setting outcomes, starting with, “Are you being asked to deliver outputs or outcomes?”

Good discovery starts with a clear outcome. Your outcome sets the scope for your discovery. In the #CDHBenchmarkSurvey, we asked teams, ‘Are you being asked to deliver outputs or outcomes?’ – Tweet This

Before answering this question, respondents saw this description of outcomes vs. outputs:

Outcomes vs. Outputs

An outcome is a metric that measures the impact of your work. It’s typically derived from your business model (e.g. business outcomes) or represents a behavior your customer does in your product (e.g. product outcomes).

Outputs are the things that we produce—for product teams this usually means features, initiatives, or programs.

OKRs are a popular way of expressing an outcome.

A chart visualizing results to the question, "Is your team currently being asked to deliver outcomes or outputs?"

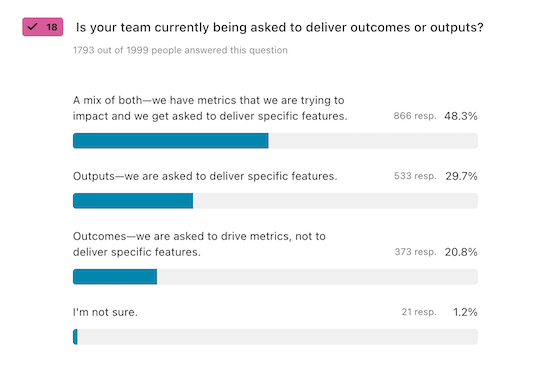
The majority of respondents said their teams are asked to deliver a mix of outcomes and outputs.

I was not surprised to see the most common response (48.3%) was: “A mix of both—we have metrics that we are trying to impact and we get asked to deliver specific features.” Most of us are still learning to start with outcomes and change often happens slower than we want.

I was thrilled to see that 20.8% selected: “Outcomes—we are asked to drive metrics, not to deliver specific features.”

For the 30+% who selected “Outputs—we are asked to deliver specific features” or “I’m not sure,” don’t be discouraged. You can start to build your own outcome mindset before your organization catches up. Doing so will help you build better products regardless of your organizational context. If you want help building your outcome mindset, check out our Defining Outcomes course.

Even if your organization isn’t outcome-focused, you can start to build your own outcome mindset before your organization catches up. Doing so will help you build better products regardless of your organizational context. – Tweet This

For the teams who selected “Outcomes” or “A mix of both,” we then asked, “How many outcomes is your team asked to work on this quarter?”

A chart visualizing answers to the question, "How many outcomes is your team asked to work on this quarter?"

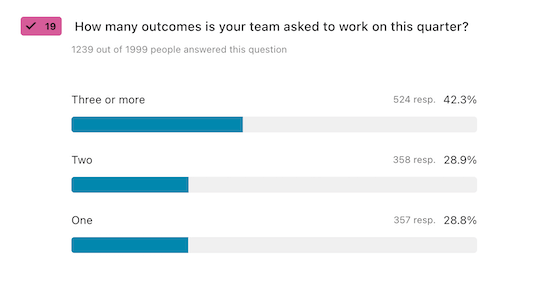
When asked how many outcomes their teams are working on, the majority of respondents said three or more. Ideally, this number should be much lower.

The results for this question are interesting. I know from working with many teams that most still have several outcomes. We are collectively trying to do too much at once.

I firmly believe that when teams work on one outcome at a time, they have a greater overall impact. When teams are split across multiple outcomes, they get pulled in too many directions and make incremental progress on each at best. I’d rather see outsized progress on one.

Only 28.8% of #CDHBenchmarkSurvey respondents said they were working on one outcome. I firmly believe that when teams work on one outcome at a time, they have a greater overall impact. – Tweet This

It’s clear from these results that focusing on a single outcome is still a minority position. However, I hope to make the case for this in my next blog post about this survey when I connect the different habits to product success.

In hindsight, for teams who are tasked with several outcomes, I should have asked if they had individual outcomes or if their team shared responsibility for several outcomes. I’ll be sure to add that to next year’s survey.

The survey explained that outcomes tend to have a directional component (e.g. increase engagement) and a target (e.g. by 10%). We wanted to understand how long a team had been working on the same directional outcome even if the target changed quarter over quarter.

Generally, I want to see a team focused on the same directional outcome over time. It takes time to learn how to impact a metric and the longer a team spends on an outcome, the more impact they’ll have. If you do a good job of deriving your outcomes from your business model, they shouldn’t need to change that often.

This doesn’t, however, mean that the way that you measure an outcome will stay constant. For example, a team might spend a year focused on increasing engagement. When they first get started, they might start by measuring daily active users. As they learn more, they might evolve to measuring DAU/MAU (daily active users divided by monthly active users). And with more time, they might define and refine specific high-value activities that count as usage. As we learn more about what makes our customers successful, we should develop better ways of measuring that success.

A chart visualizing answers to the question, "How long have you been working on the same directional outcome?"

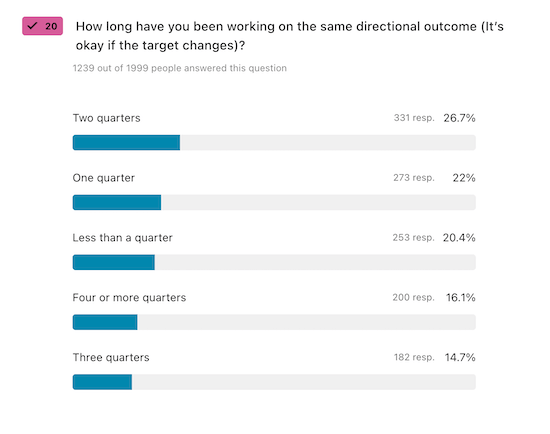
When I asked how long teams had been working on the same directional outcome, responses were spread pretty evenly across the options.

We asked, “How long have you been working on the same directional outcome?” and the responses were spread pretty evenly across the options.

  • Less than a quarter (20.4%)
  • One quarter (22%)
  • Two quarters (26.7%)
  • Three quarters (14.7%)
  • Four or more quarters (16.1%)

In my experience, teams make more progress in their second quarter working on an outcome than they do in the first. That’s because they incur a big learning tax in the first quarter that they are working on an outcome. I was thrilled to see that 57.5% of respondents were working on the same directional outcome for at least 2 quarters. I hope this trend continues.

We also asked respondents who in their organization was involved in setting their outcomes. Respondents were able to select multiple answers.

A chart visualizing the answers to the question, "Who was involved in choosing your team's outcome?"

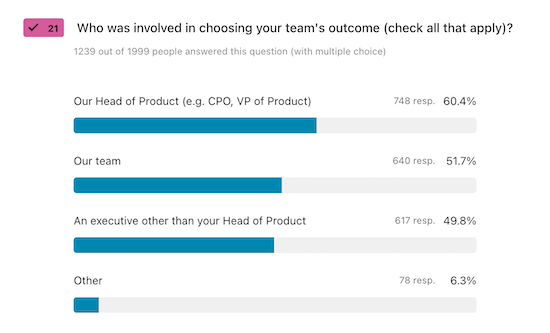
I asked who was involved in choosing outcomes and was surprised to see that such a large percentage of teams said both their team and leadership were involved.

60.4% of respondents said that their Head of Product (e.g. CPO, VP of Product) was involved. 51.7% said their team was involved. 49.8% said an executive other than their head of product was involved, and 6.3% said other.

In an ideal world, outcomes should be set by both the product team and executive leadership. Participants were able to select multiple items and here’s how the combinations broke down:

  • Just our product team (14.47%)
  • Just executives (44.54%)
  • The team plus any executive leadership (36.38%).

In my experience coaching teams, it seems like either the team picks their outcome (with little to no input from leadership) or leadership picks the outcome (with little to no input from the team). So I was surprised to see that 36.38% of respondents said that both their team and leadership were involved.

The “Other” responses were a reminder that people don’t have great reading comprehension on the web. The most common responses were “CEO” and “Head of Product” (which were both options they could have selected). Other common responses included the product manager, the sales team, the CTO (again, one of the options), and Directors of Product or Engineering.

Understanding Team Exposure to Customers

I’ve long said that the keystone habit to discovery is regular engagement with customers. When we connect with customers on a regular basis, we get exposed to the gap between how we think about our products and how our customers think about them. When teams see this gap, they tend to be motivated to overcome it. They tend to interview more and run more assumption tests.

So naturally, we asked, “When was the last time you talked to a customer?”

A chart visualizing the answers to the question, "When was the last time you talked to a customer?"

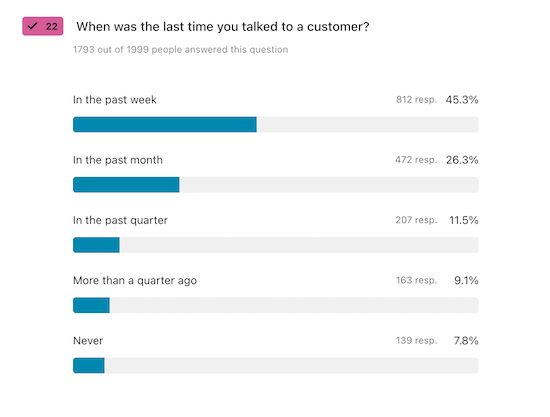
I asked participants when they last spoke to a customer and I was happy to see 45.3% said in the past week.

I was happy to see that 45.3% of respondents said “In the past week.” 26.3% said “In the past month,” 11.5% said “In the past quarter,” 9.1% said “More than a quarter ago,” and 7.8% said “Never.”

45.3% of #CDHBenchmarkSurvey respondents said they have talked to a customer in the past week. 26.3% said they talked to a customer in the past month. – Tweet This

But before we get too excited about these results, I know that for many of these respondents, “talking to a customer” often means getting pulled into a sales call or being consulted on a support ticket. While these are important activities, they aren’t a replacement for good customer interviews.

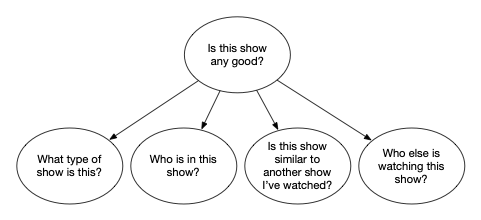
So we also asked, “When was the last time you conducted a story-based interview?” Now I know that story-based interviewing isn’t the only way to interview customers. But I do believe it is the most reliable way to learn about our customers (aside from observing them).

We didn’t assume that people knew what story-based interviewing was, so we showed them the following description before asking:

A story-based interview is where the interviewer keeps the participant grounded in a specific story about their past behavior.

For example: “Tell me about the last time you watched Netflix.”

Not: “Tell me about your experience on Netflix.”

Not: “What do you like to watch on Netflix?”

Not: “Would you watch this on Netflix?”

A chart visualizing the answers to the question, "When was the last time you conducted a story-based interview?"

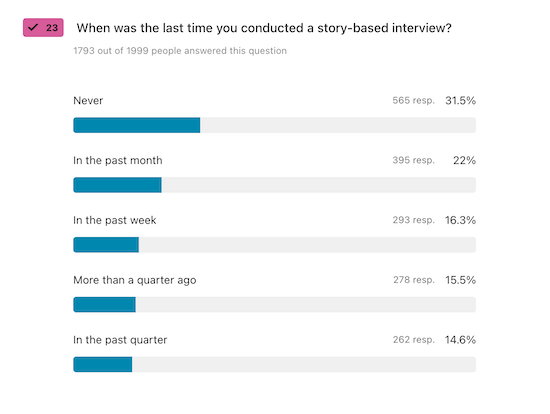
I’m thrilled to see so many respondents say they conducted a story-based interview last week. Yes!

I was pretty happy with the results:

  • In the past week (16.3%)
  • In the past month (22%)
  • In the past quarter (14.6%)
  • More than a quarter ago (15.5%)
  • Never (31.5%)

It wasn’t too long ago that I was regularly criticized for being too idealistic when I suggested teams talk to customers every week. I’m thrilled to see that 293 of our respondents said they conducted a story-based interview last week. Yes! I also know that it takes time to get to this cadence, so I was equally thrilled to see that an additional 395 had conducted a story-based interview in the last month.

While these results do indicate we have more work to do—with 47% respondents having either never conducted a story-based interview or having done so more than a quarter ago—they also represent tremendous progress.

This question asks about one moment in time—last week. I also wanted to know who was building a habit of weekly interviewing. So for people who said they interviewed last week, we also asked, “Looking back over the past few weeks, how many consecutive weeks have you conducted at least one story-based interview each week?”

A chart visualizing the answers to the question, "Looking back over the past few weeks, how many consecutive weeks have you conducted at least one story-based interview each week?"

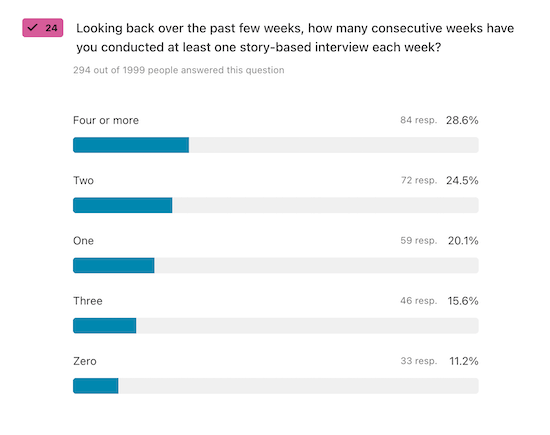
It was exciting to see that 28.6% of respondents had been interviewing weekly for at least four weeks in a row.

And here were their responses:

  • Zero (11.2%)
  • One (20.1%)
  • Two (24.5%)
  • Three (15.6%)
  • Four or more (28.6%)

I was thrilled to see that 28.6% of respondents who said they interviewed last week had a 4 or more week streak going. That’s a sign of a strong habit.

28.6% of #CDHBenchmarkSurvey respondents who said they interviewed last week indicated that they had a 4+ week interviewing streak. Yes! That’s a sign of a strong habit. – Tweet This

I was not surprised to see that most folks are still struggling to build a habit. This is still a new idea for most teams and it takes time to turn this into a sustainable habit.

I was confused by the high percentage of people (11.2%) who said zero. They only saw this question if they said they had interviewed in the previous week, so at a minimum they should have chosen 1.

Synthesizing What You Learn from Interviews

While there is some benefit from mere exposure to customers, the real value comes from synthesizing what we are learning in our interviews. To understand teams’ habits in this area, we asked a series of questions. We started with, “Did you identify any opportunities in your last interview?”

We didn’t assume that respondents would know what we meant by “opportunity,” so we defined it as follows before they saw the question:

An opportunity is an unmet customer need, pain point, or desire. It’s not a solution or feature request.
A chart visualizing the answers to the question, "Did you identify any opportunities in your last interview?"

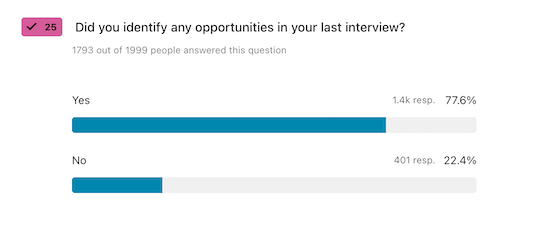
I was surprised to see that 77.6% of respondents said they’d identified opportunities in their last interview because I find most teams aren’t clear on the definition of “opportunity.”

I was surprised to see that 77.6% of respondents said yes. In my experience coaching teams, this is not an automatic next step. And I find that most teams aren’t clear on what counts as an opportunity and what doesn’t. I realize now that I also should have asked those who said yes to share an opportunity from their last interview, so I could better assess if we mean the same thing by “opportunity.” I’ll add that to next year’s survey.

We also asked, “Did you create an interview snapshot for your last interview?” Interview snapshots are a way to visually synthesize what you are learning from each interview. They are by no means required (there are other techniques for synthesizing what you learned), but it’s the one that I recommend, so I wanted to measure how many teams were adopting them.

A chart visualizing the answers to the question, "Did you create an interview snapshot for your last interview?"

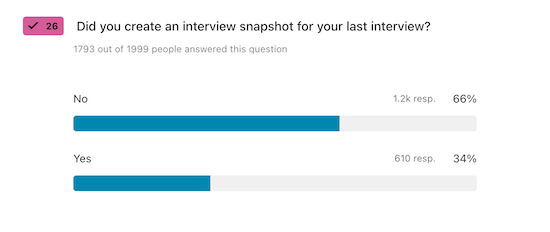
I was thrilled to see that 34% of respondents created an interview snapshot from their last interview—it’s always nice to see how something you created has an impact on teams.

Creating interview snapshots regularly takes discipline and I know many good continuous discovery teams who don’t bother. So I was thrilled to see that 34% of respondents said yes. This one was rewarding for me. It’s always nice to see how something you created has an impact on teams.

34% of #CDHBenchmarkSurvey respondents who conducted an interview said they created an interview snapshot afterwards. I love seeing teams adopt this practice. – Tweet This

Product Talk readers know that I recommend product trios interview together. To assess how teams are doing, for the teams who earlier indicated that they worked in a product trio, we asked, “Did your entire product trio participate in your last customer interview?”

A chart visualizing the answers to the question, "Did your entire product trio participate in your last customer interview?"

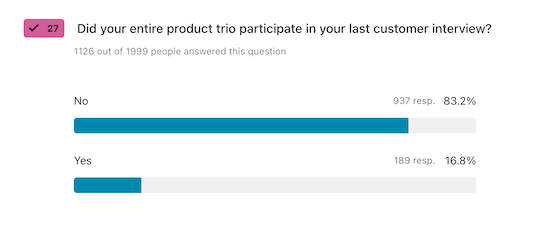
I was disappointed to see that the majority of respondents said their entire trio hadn’t participated in their last customer interview.

While the responses here didn’t surprise me, they did disappoint me. I really had hoped we had made more progress on this front. Only 16.8% of respondents said yes, whereas 83.2% said no.

For the folks who said no, we asked, “Who from your product trio didn’t participate in your last interview? (select all that apply)”

A chart visualizing the answers to the question, "Who from your product trio didn't participate in your last interview?"

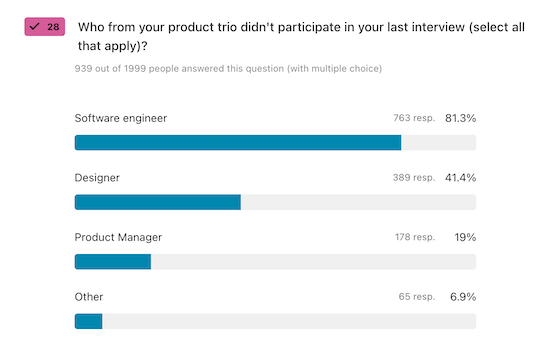
For the majority of respondents, their engineer was missing from their last customer interview.

I was not surprised to see that 81.3% of the respondents said that engineering was missing. Far too many companies still think the only value engineers offer is writing code. I would love to see us make much more progress on this front.

81.3% of #CDHBenchmarkSurvey respondents (who did not interview as an entire product trio) said their engineers were missing from the interview. Let’s get more engineers involved in discovery! – Tweet This

41.4% of respondents said the designer was missing and 19% of respondents said the product manager was missing. I suspect these results were heavily influenced by the fact that an overwhelming majority of our respondents were from the product management function (69.43%).

These results indicate that we still have work to do when it comes to collaborating as a trio. I’m a strong proponent of trios because they ensure you bring different perspectives into your interviewing and decision-making.

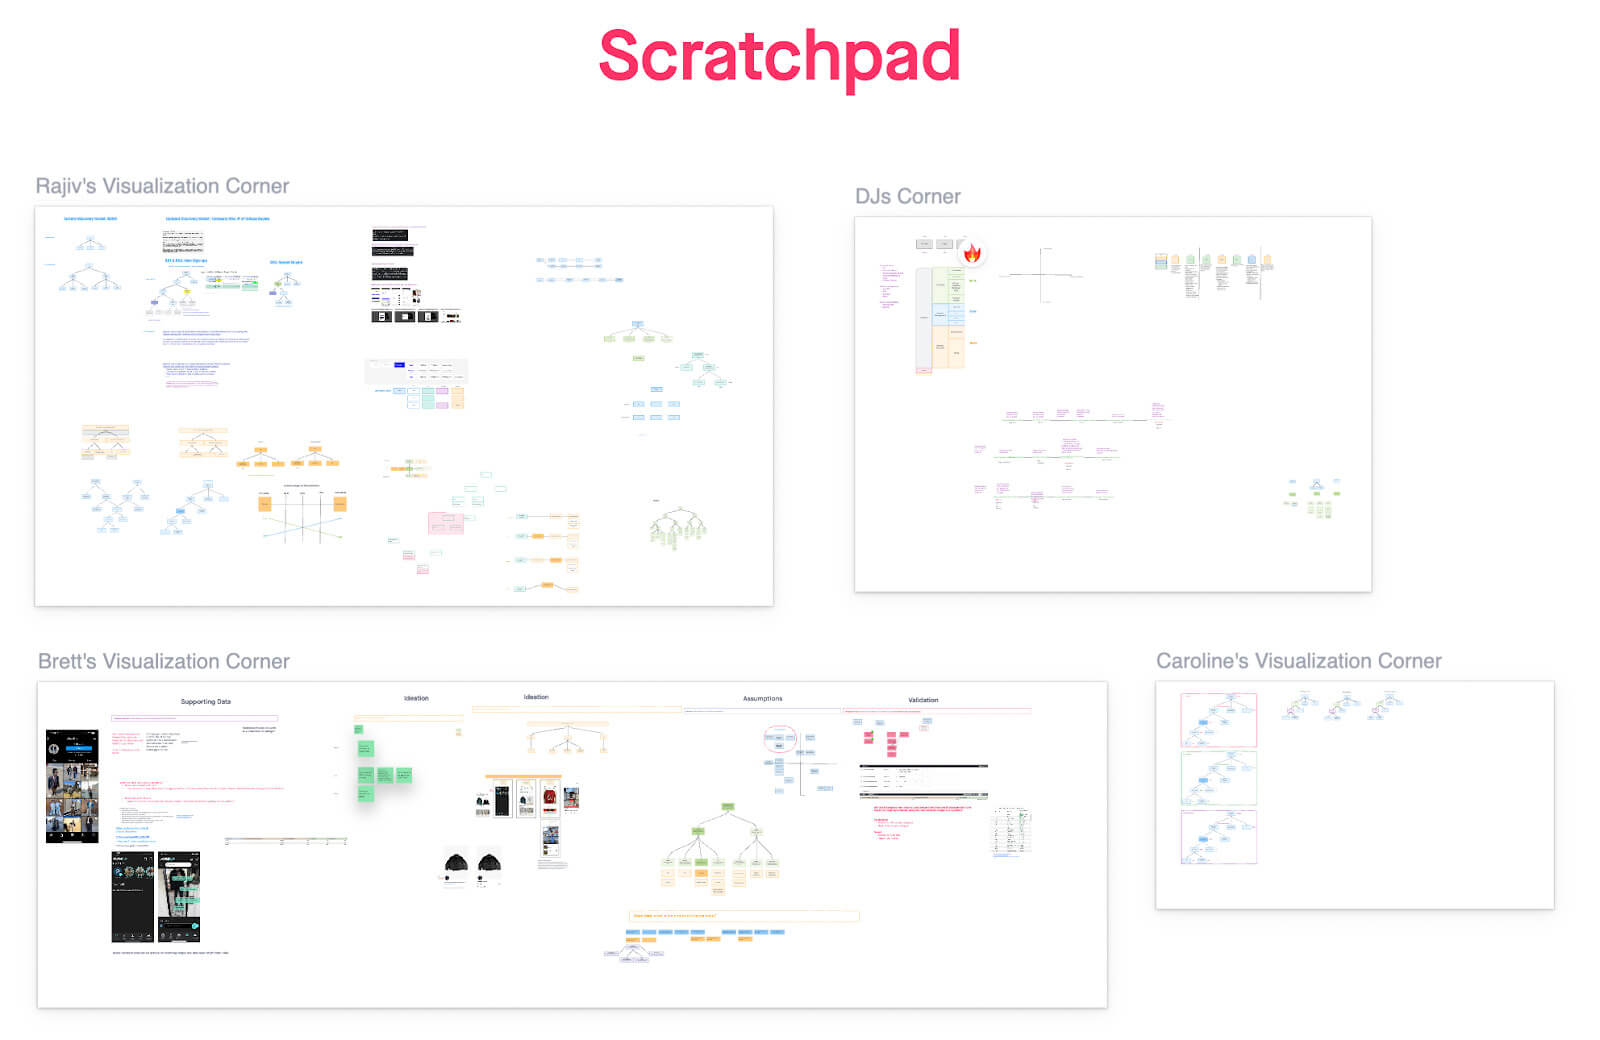
Visualizing Your Thinking: Experience Maps, Opportunity Solution Trees, and Story Maps

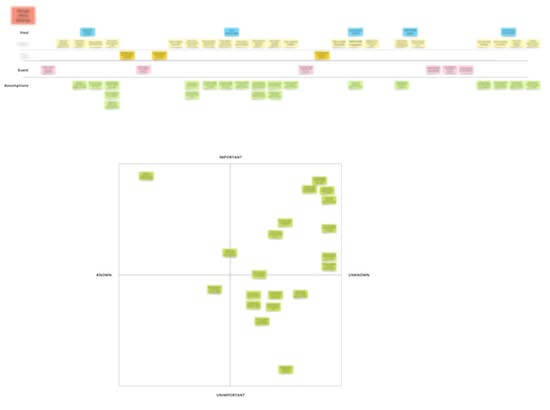
One of the key themes in my book Continuous Discovery Habits is for teams to visualize their thinking. The book includes a number of visuals designed to help teams align and examine their thinking including opportunity solution trees, experience maps, story maps, and much more.

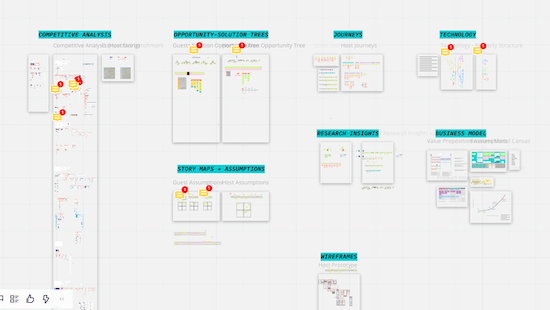
We wanted to better understand who was adopting which visuals and how they were integrated into their day-to-day work.

We started by asking, “Is your team currently using any of the following visuals? (check all that apply)”

A chart visualizing the answers to the question, "Is your team currently using any of the following visuals?"

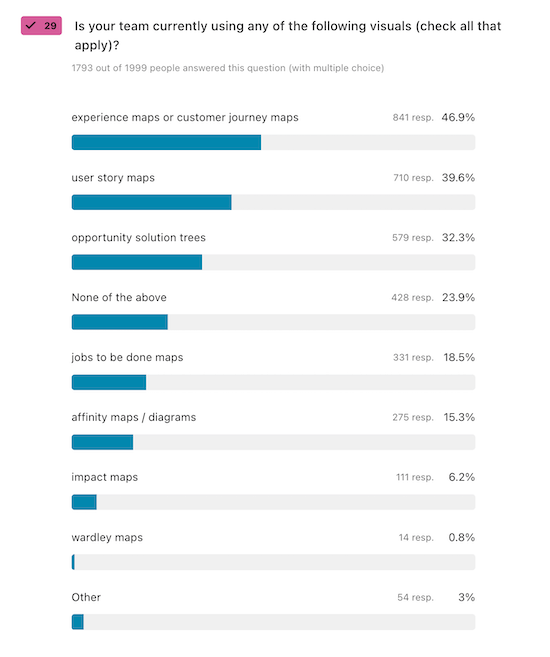
Respondents tend to use experience maps and customer journey maps—a result that’s not too surprising since these are both broad categories and well-known techniques.

Experience maps and customer journey maps were the most commonly used visuals (46.9% of respondents), followed by user story maps (39.6% of respondents), opportunity solution trees (32.3% of respondents), jobs to be done maps (18.5% of respondents), affinity maps/diagrams (15.3% of respondents), impact maps (6.2% of respondents), and Wardley maps (0.8% of respondents). 23.9% said they weren’t using any of these visuals and 3% said they were using some other visuals.

Customer journey maps and experience maps were the most commonly reported visual used (46.9% of #CDHBenchmarkSurvey respondents), followed by user story maps (39.6%), and opportunity solution trees (32.3%). – Tweet This

I’m not surprised that experience mapping and customer journey mapping came out on top. These are broad categories and are well-known techniques.

I was thrilled to see user story maps and opportunity solution trees not too far behind.

I was surprised to see that 23.9% of respondents aren’t using any visuals. I have a hard time imagining good product trio collaboration without them. I’ll be looking at the relationships between the different variables in a different post and will be excited to see how the use of visuals impacts team collaboration and team satisfaction.

I’ve met a lot of teams who are good at creating an experience map or customer journey map one time, but then never revisit it or update it as they continue to learn. So for respondents who said they used experience maps or customer journey maps, we asked, “When was the last time your team updated your experience map or customer journey map?”

A chart visualizing the answers to the question, "When was the last time your team updated your experience map or customer journey map?"

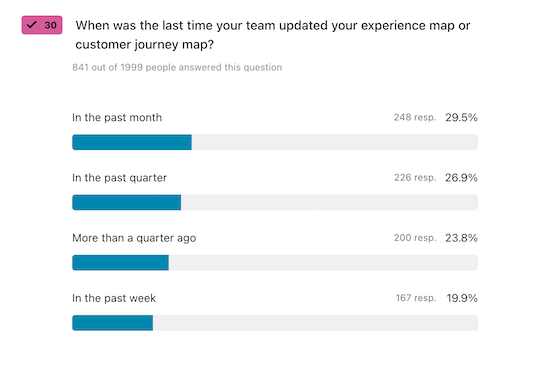
I’m happy to see that many teams are frequently updating their experience maps or customer journey maps.

I was happy to see that 19.9% of respondents said in the past week, 29.5% said in the past month, and 26.9% said in the last quarter. That tells me that these artifacts are living documents as intended. 23.8% of respondents said it’s been more than a quarter since they’ve updated their experience maps or customer journey maps.

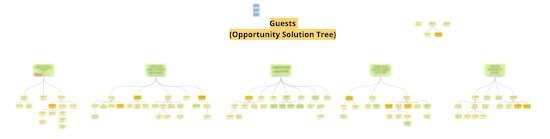
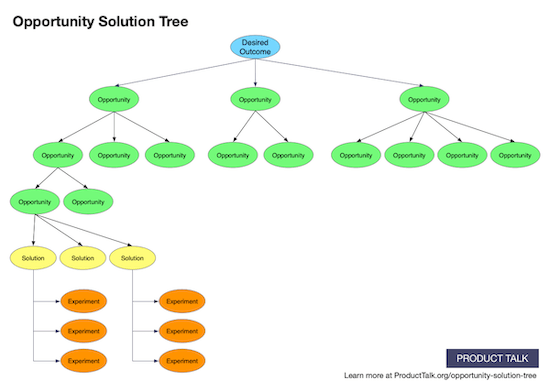
For respondents who said they used opportunity solution trees, we asked them, “When was the last time you updated your opportunity solution tree?”

A chart visualizing answers to the question, "When was the last time your team updated your opportunity solution tree?"

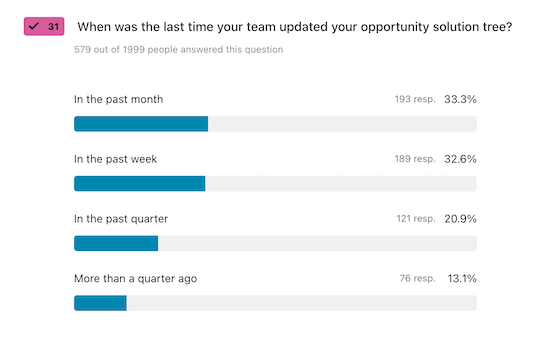
The number of people who said they’d updated their opportunity solution tree in the past week or month tells me most teams are using opportunity solution trees as intended.

As a general rule, I want to see teams update their opportunity solution tree every 3–4 interviews. If they are interviewing weekly, that’s at least once a month. So I was thrilled to see that 32.6% of respondents said in the past week and 33.3% said in the past month. That tells me that most teams are using their opportunity solution trees as intended.

20.9% of respondents said in the past quarter and 13.1% of respondents said more than a quarter ago. I tend to see teams drop off from updating their opportunity solution tree when they have a hard time building a sustainable interviewing habit. We’ll see if this relationship holds up in the next post when we look at relationships between the variables.

Getting Value Out of Opportunity Solution Trees

One of the most common ways people misinterpret the intent of an opportunity solution tree is they think they can map the opportunity space without talking to customers. This kind of makes sense. Most product teams have some knowledge of their customers’ needs, pain points, and desires.

Teams are constantly inundated with feature requests, sales feedback, new trends from behavioral analytics, and so much more. But these sources rarely contain enough context for a team to really understand the need, pain point, or desire at any depth. It’s hard to truly solve for an opportunity if we don’t fully understand it.

I like to see teams source opportunities from customer interviews and observations, not from previous knowledge (e.g. often assumptions) or internal stakeholders. So we asked teams, “Where did the opportunities on your current opportunity solution tree come from? (check all that apply)”

A chart visualizing answers to the question, "Where did the opportunities on your current opportunity solution tree come from?"

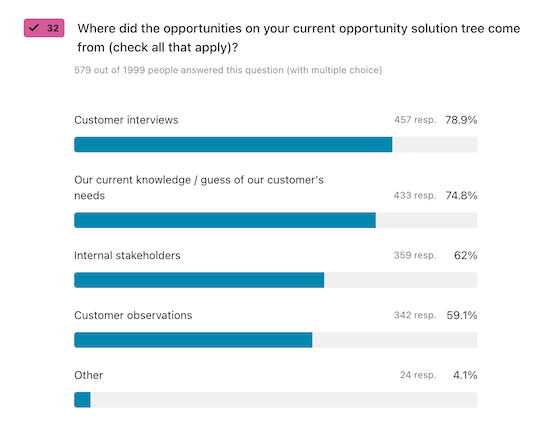
I’m concerned to see how many respondents said their opportunities came from their current knowledge or internal stakeholders instead of directly from customers.

I was very happy to see that 78.9% of respondents said customer interviews and 59.1% said customer observations. That second number really surprised me. I recommend interviewing over observations, because it’s easier to interview every week than it is to observe customers every week. But observations are a fantastic source of opportunities and I’m glad to see that so many teams are doing them.

74.8% of respondents said opportunities came from their current knowledge or a guess of their customers’ needs and 62% said opportunities came from internal stakeholders. These responses concern me. To be clear, I think internal stakeholders and team members can speculate about customer opportunities, but we need to verify that these opportunities are real by hearing about them directly from customers. This tells me that while many teams are adopting the opportunity solution tree as a way to visualize their thinking, they are missing some of the core benefits of the framework.

Only 3.8% of respondents limited the opportunities on their opportunity solution tree to the ones they are hearing in interviews or are observing directly. If you want to dive into why this is so important, start with this article on sourcing opportunities and then read this one about why these other sources of data are not enough.

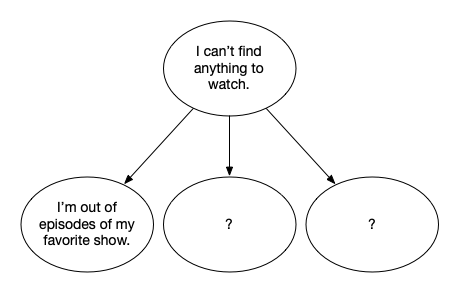
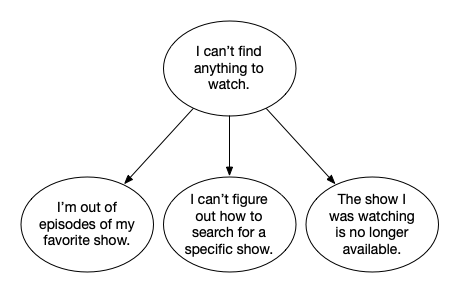
Another common challenge for people who are new to opportunity solution trees is it’s hard to break their project mindset and develop a truly continuous mindset. Most of us are used to working on several-week or even multiple-month projects. And as a result, we tend to define large opportunities and work with too many at once.

Instead, I prefer that as people move vertically down the opportunity space, they learn to break big opportunities into smaller and more solvable opportunities. When you get good at this, you should be able to discover and deliver teeny-tiny solutions to teeny-tiny opportunities.

Each iteration contributes to a cohesive whole and chips away at the harder opportunities higher up on the tree. This is what unlocks a truly continuous mindset, as you are able to discover and deliver solutions for a single opportunity and then quickly move on to the next opportunity.

To assess how well teams are doing this, we asked, “How many opportunities (needs, pain points, and desires, not solutions) is your team working on right now?”

A chart visualizing answers to the question, "How many opportunities (customer needs, pain points, or desires, not solutions) is your team working on right now?"

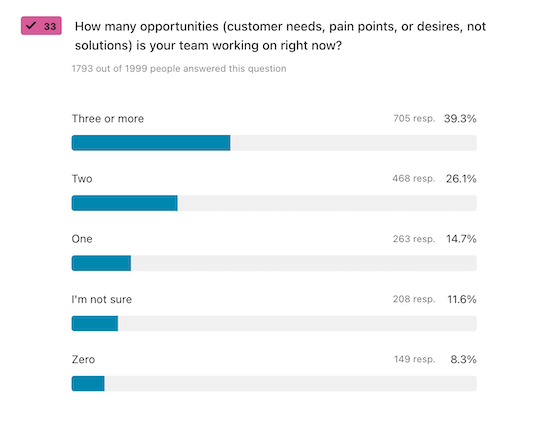
I suspect that many teams are taking on too many opportunities at once and not having their desired impact as a result.

Only 14.7% of respondents said 1. This is not terribly surprising. We all still assume we can do way more than we can. Also, as teams are learning how to accelerate their discovery cycles, it might make sense to work on 2 or 3 opportunities at a time. They might be brainstorming new solutions for one, while waiting for assumption tests results for a second, while delivering a third.

For the 26.1% who said 2 and the 39.3% who said 3 or more, if their opportunities are flowing through ideation, assumption testing, and delivery and there’s one opportunity in each stage, that’s fine. But I suspect many of these teams are biting off more than they should. It takes a giant leap of faith to trust that you can have more impact by limiting work in progress and focusing on one thing at a time. Even I struggle with this.

Another key benefit of an opportunity solution tree is it helps us see where we are comparing and contrasting options and where we are getting stuck in whether or not decisions.

Based on what we know from decision-making research, I want to see teams working with multiple solutions for the same target opportunity.

For teams who were working on one opportunity at a time, we asked, “For your current target opportunity, how many solutions is your team currently considering?” And for teams who are working on several opportunities at once, we asked, “For your current target opportunities, how many solutions is your team currently considering on average for each opportunity?”

A chart visualizing answers to the question, "For your current target opportunity, how many solutions is your team currently considering?"

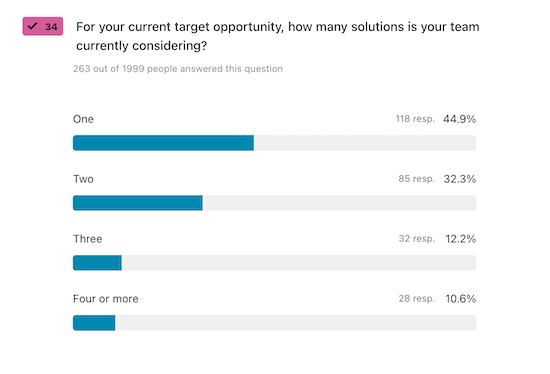
For teams working on one opportunity at a time, the majority are considering one solution.

A chart visualizing answers to the question, "For your current target opportunities, how many solutions is your team currently considering on average for each opportunity?"

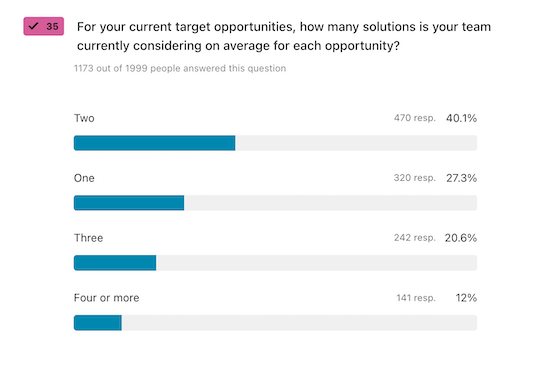
For teams working on more than one opportunity, a larger percentage are considering multiple solutions.

These results are interesting. For teams who are working on one opportunity at a time, 44.9% said they are considering 1 solution, 32.3% said 2 solutions, 12.2% said 3, and 10.6% said 4 or more.

Meanwhile, for teams who are working on multiple opportunities at once, 27.3% said they were considering on average 1 solution per opportunity, 40.1% said 2 on average, 20.6% said 3 on average, and 12% said four or more.

I’m skeptical of these results. I find it hard to believe that more teams who are working with multiple opportunities at the same time (40.1% of them) are exploring 2 solutions on average, when only 32.3% of teams who are working on one opportunity are exploring 2 solutions. I have a feeling the “on average” tripped people up here and we may not have collected reliable data. I’ll think about ways to improve that for next year’s survey.

Either way, too many teams are still working with one idea at a time. For teams who are working on multiple ideas, I’d love to learn if these are true compare and contrast situations or if these are multiple solutions in development.

Understanding Where Solution Ideas Come From

Ideas can and should come from anywhere. Research on ideation suggests that the more people involved in ideation, the more ideas we’ll generate. The same research suggests the more ideas we generate, the better ideas we have.

So we asked respondents, “For the opportunities that you are working on right now, who contributed solution ideas? (check all that apply)”

A chart visualizing answers to the question, "For the opportunities that you are working on right now, who contributed solution ideas?"

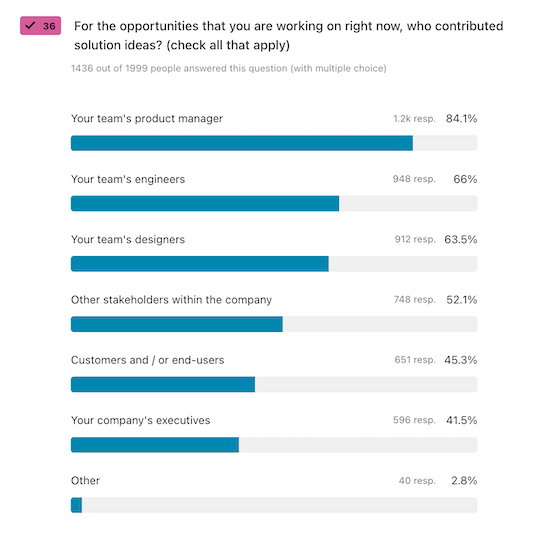
It looks like a lot of people are contributing solution ideas, but because respondents could select multiple options, the reality is more complicated.

84.1% of respondents said their product manager contributed ideas, 66% said engineers contributed ideas, 63.5% said designers contributed ideas, 52.1% said other stakeholders contributed, 45.3% said customers contributed, and 41.5% said the company’s executives contributed. This makes it look like a lot of people are contributing ideas. But because people were able to select multiple options, the reality is more complicated.

11.7% of respondents chose only one option. For this group, their responses broke down as follows:

  • Just product managers (33.53%)
  • Just designers (10.18%)
  • Just engineers (19.16%)
  • Just executives (16.17%)
  • Just other stakeholders (12.57%)
  • Just customers (8.38%)

18.43% of respondents indicated that product managers, executives, stakeholders, and customers contributed ideas. This group might represent a more traditional model where product managers work with stakeholders to “gather requirements.” It unfortunately leaves designers and engineers out of the process.

6.52% of respondents indicated their product team members were not involved in ideation—only executives, other stakeholders, and customers contributed ideas. It’s clear these teams are not empowered to generate their own ideas.

20.67% of respondents indicated that executives, stakeholders, and customers did not contribute ideas—only their product manager, designer, and/or engineers.

On a positive note, 46.11% of respondents indicated that their product manager, their designers, and their engineers contributed ideas. This is a great indication that we are making progress on truly collaborative product trios.

46.11% of #CDHBenchmarkSurvey respondents said their product manager, designers, and engineers contributed ideas. This is a great indication we are making progress on truly collaborative product trios. – Tweet This

And 10.23% of respondents indicated that all of these roles contributed ideas. As long as the product trio is empowered to test and decide which ideas to pursue, I think this is optimal. I like to see ideas coming from everywhere.

Evolving Solutions: Getting to Good Ideas

When a team is engaged in continuous discovery, their solution ideas should be constantly evolving. Bad ideas should be thrown out. Mediocre ideas should be improved. It’s rare that a good idea is simply found. Instead, we have to work to evolve our ideas into solutions that might work for our customers.

The best way to learn what’s working with an idea and what’s not is to run assumption tests. We asked respondents, “How many assumption tests or product experiments did you run last week?”

A chart visualizing answers to the question, "How many assumption tests or product experiments did your team run last week?"

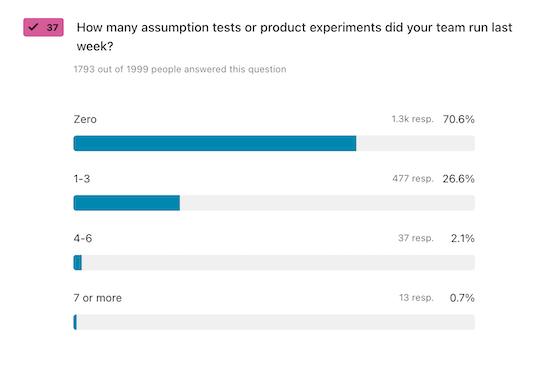
Assumption testing is one of the hardest habits to build, so I’m not surprised to see the majority of teams didn’t run any tests last week.

A whopping 70.6% of respondents said zero, 26.6% said 1–3, 2.1% said 4–6, and 0.7% said 7 or more. This is not surprising. We see this same trend with the teams that we work with and in our community.

Assumption testing is one of the hardest habits to build. We still have a long way to go here. If you want help building this habit, check out our Identifying Hidden Assumptions and Assumption Testing courses.

An overwhelming majority of #CDHBenchmarkSurvey respondents (70.6%) did not run a single assumption test in the prior week. This is one of the hardest discovery habits to build. – Tweet This

For the folks who answered 1 or more, we also asked, “What types of assumption tests or product experiments did you run last week? (check all that apply)”

A chart visualizing answers to the question, "What types of assumption tests or product experiments did your team run last week?"

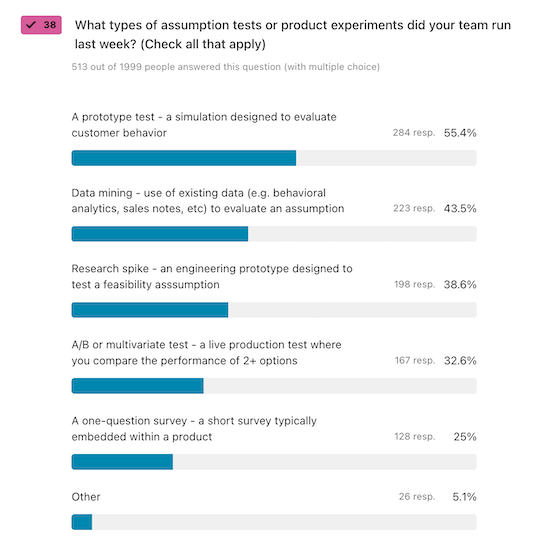
The most common type of assumption test or experiment is a prototype test, followed by data mining.

I was not surprised to see prototype testing come out on top. Here’s the breakdown:

  • A prototype test—a simulation designed to evaluate customer behavior (55.4%)
  • Data mining—use of existing data (e.g. behavioral analytics, sales notes, etc.) to evaluate an assumption (43.5%)
  • Research spike—an engineering prototype designed to test a feasibility assumption (38.6%)
  • A/B or multivariate testing—a live production test where you compare the performance of 2+ options (32.6%)
  • A one-question survey—a short survey typically embedded within a product (25%)
  • Other (5.1%)—about half of these responses were customer interviews and the rest were specific types of prototype tests like comprehension tests, usability tests, concierge tests, etc.

As I mentioned in the opening of this section, good discovery teams should be exploring many ideas and throwing many of them away. We asked all respondents, “When was the last time your team discarded a solution that your team was considering?”

A chart visualizing answers to the question, "When was the last time your team discarded a solution that your team was considering?"

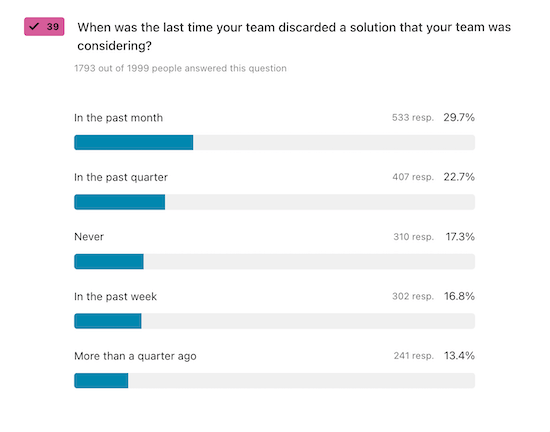
I’m happy to see that a large percentage of teams said they discarded an idea in the past week or month.

Here are how the responses broke down:

  • In the past week (16.8%)
  • In the past month (29.7%)
  • In the past quarter (22.7%)
  • More than a quarter ago (13.4%)
  • Never (17.3%)

I’m happy to see that 46.5% of respondents said they discarded an idea in the past week or month. I’m a little dismayed (although not surprised) that 30.7% of respondents either never discarded an idea or haven’t done so in more than a quarter.

Ideas are cheap. We know exploring many ideas is what gets us to good ideas. We need to be throwing out lots of ideas if we want to better serve our customers.

But assumption testing doesn’t just help us eliminate ideas, it also helps us evolve our mediocre ideas into good ideas. So we also asked, “When was the last time you iterated on a solution based on something you learned from an assumption test or product experiment?”

A chart visualizing answers to the question, "When was the last time you iterated on a solution based on something you learned from an assumption test or product experiment?"

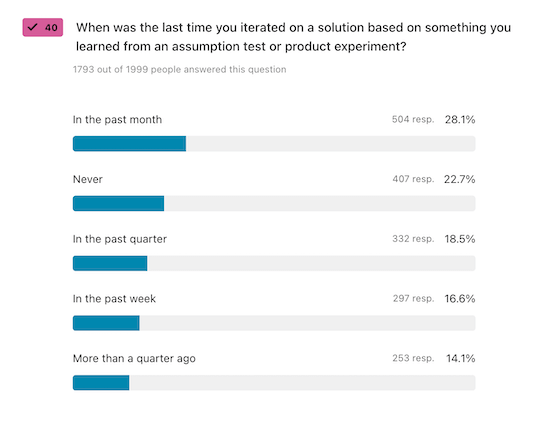
I’m glad to see that a large percentage of teams have iterated on their solutions in the past week or month, but dismayed that so many have either never iterated on an idea or haven’t done so for more than a quarter.

16.6% of respondents said “In the past week,” 28.1% said “In the past month,” 18.5% said “In the past quarter,” 14.1% said “More than a quarter ago,” and 22.7% said “Never.” Again, I’m glad to see that 44.7% of respondents said they iterated on their ideas in the past week or month. And I’m dismayed that 36.8% have either never iterated on an idea or it’s been more than a quarter.

This tells me that teams who are assumption testing are using their tests to both throw out bad ideas and to iterate on their mediocre ideas. However, it also tells me that a lot of teams still need help with this habit and that far too many teams are simply building their initial ideas without any evolution. It’s no surprise, then, why so many solutions simply don’t work.

Discovery Tools: Who is Using What

If I think back 15–20 years ago and consider what we had to do to connect with customers, test our ideas, and tabulate results, we have come a long way. Gone are the rooms with two-way mirrors. We no longer spend $30,000 to rent a facility to run a single usability study. We aren’t limited to recruiting participants in our nearby geographic region.

Instead, we have access to amazing discovery tools that help us recruit participants, conduct interviews around the world, launch in-product surveys, design unmoderated prototype tests, and so much more.

We wanted to learn who was taking advantage of these tools. So we asked, “What tools does your team have access to to support your discovery work? (check all that apply)”

A chart visualizing answers to the question, "What tools does your team have access to to support your discovery work?"

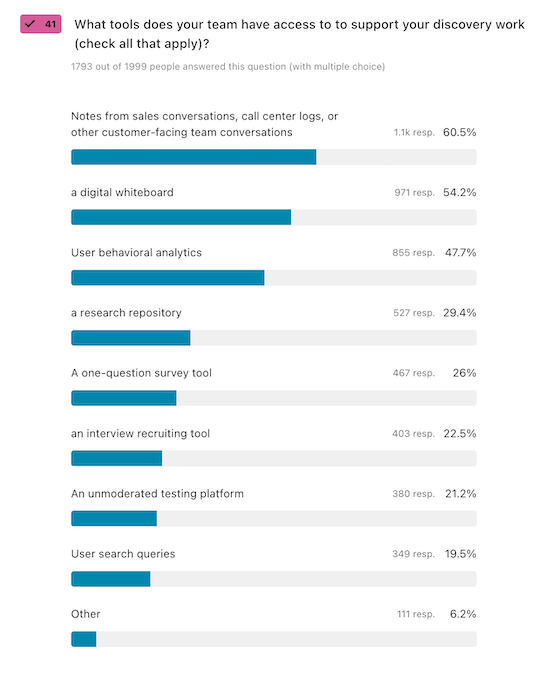
Product teams have more tools than ever at their disposal to support their discovery work.

Here’s what respondents said they have access to:

  • Notes from sales conversations, call center logs, or other customer-facing communications (60.5%)
  • A digital whiteboard (54.2%)
  • User behavioral analytics (47.7%)
  • A research repository (29.4%)
  • A one-question survey tool (26%)
  • An interview recruiting tool (22.5%)
  • An unmoderated testing platform (21.2%)
  • User search queries (19.5%)
  • Other (6.2%)

Over 50% of the “Other” responses were “none of the above.” I should have added that as an option. Other tools that came up under “Other” included heat maps, long-form survey tools, design tools like Figma and InVision, and Google.

I am surprised to see digital whiteboards have such widespread adoption. This is a testament to Miro and Mural for really building this market over the last few years. I was surprised and dismayed to see that fewer than half of the respondents had access to user behavioral analytics and less than 20% had access to search queries.

I’d love to see the market for all of these tools continue to grow. They really do help us shorten our discovery cycles and that’s better for everyone.

What’s Next?

As I wrote in the first post about this survey, I had two questions I wanted to answer with this survey:

  1. how many people were adopting each of the continuous discovery habits that I outlined in my book.
  2. if teams with better habits were more likely to have success than teams who haven’t developed their habits.

We’ve tackled the first question in this post. It is clear that many teams are working on adopting the different discovery habits. And I hope to see even more progress next year.

In future posts, I’ll dive into the second question. I have a series of hypotheses that I outlined when designing the survey that I’ll evaluate so that we can get a better idea of how different habits impact team success. If you don’t want to miss those posts, be sure to subscribe below.

The post Insights from the CDH Benchmark Survey: How Are Teams Adopting Discovery Habits? appeared first on Product Talk.


Insights from the CDH Benchmark Survey: How Are Teams Adopting Discovery Habits? was first posted on March 1, 2023 at 6:00 am.
©2022 "Product Talk". Use of this feed is for personal non-commercial use only. If you are not reading this article in your feed reader, then the site is guilty of copyright infringement. Please let us know at support@producttalk.org.

Sourcing Opportunities: Unlocking the Power of Opportunity Mapping

The opportunity solution tree is a visual representation of your continuous discovery work. It helps you keep track of your high-level outcomes, the unmet needs, desires, and pain points (or what I collectively refer to as “opportunities”) you’re hearing about from customers, the solutions you’re considering, and sometimes the assumptions you’ve identified and tests you’re running to validate those assumptions.

That’s a lot of material to cover! So if you’re feeling lost or overwhelmed by any of it, you’re not alone.

I recently recorded a brief video to take a closer look at one aspect of the opportunity solution tree—opportunity mapping. This will be the first in a series intended to provide quick, simple instruction on fundamental continuous discovery concepts.

You’ll find the video below, along with a lightly edited transcript.

I’ve been hearing from more and more teams who are trying to create one of my opportunity solution trees, but they’ve gotten stuck or given up. If this is you, you aren’t alone. Opportunity mapping is hard. Let’s dig into why.

I’ve been hearing from more and more teams who are trying to create one of my opportunity solution trees, but they’ve gotten stuck or given up. If this is you, you aren’t alone. Opportunity mapping is hard. – Tweet This

Teresa explaining that opportunity mapping requires 3 key steps: identifying opportunities, framing them properly, and uncovering the hidden structure of the opportunity space.

To create an opportunity solution tree, we have to do three things. First, we have to identify relevant opportunities. Second, we have to frame those opportunities properly. And finally, we have to uncover the hidden structure of the opportunity space. Only then does the opportunity map start to fall into place.

In this video, I’m going to dive deep on number one. Too many teams generate opportunities from thin air. They capture what they think their customers need, want, or desire. This is easy to do. Every product team has some knowledge about their customers, but it’s a classic garbage in, garbage out kind of situation.

Too many teams generate opportunities from thin air. They capture what they think their customers need, want, or desire. This is easy to do, but it’s a classic garbage in, garbage out kind of situation. – Tweet This

Here’s why: An actionable opportunity is specific. It occurs in a specific moment in time. It occurs in a specific context. It’s experienced by a specific customer. It’s hard to generate these specifics off the top of our head.

Let’s compare a couple of examples:

  1. I can’t find something to watch.
  2. I want to watch Avatar, but I don’t know which streaming service it’s available on.
  3. I like intriguing sci-fi, but not dumb action films. I can’t tell if I’ll like this movie.

Number one is what we get when we try to generate opportunities off the top of our head. Here’s the challenge: We could spend the rest of our lives trying to solve for number one.

Number two and number three, on the other hand, are more specific and much more actionable. I suspect many of you can think of several good solutions for number two and number three.

That’s the power of a well-framed opportunity. It opens up the solution space.

But where do these specific opportunities come from? We can’t simply pull them out of thin air. We can’t make them up.

Instead, we need to collect them. We need to interview our customers. We need to ask the right questions. Opportunities emerge from customer stories.

When we collect stories about specific past behavior, we get context, we get nuance, and most importantly, we get specifics. And those specifics lead to actionable opportunities.

When we collect stories about specific past behavior, we get context, we get nuance, and most importantly, we get specifics. And those specifics lead to actionable opportunities. – Tweet This

But collecting stories isn’t easy. It’s a skill we need to practice and develop.

If I say, “Tell me about the last time you watched TV,” you’ll likely respond, “I watched a show last night after dinner.”

That’s not a very good story.

My job as the interviewer is to help you tell your story. I need to help situate you in that moment. I need to help you remember the details. I need to assure you that I want to hear all the details. I need to excavate the story step by step.

And my reward for doing this is opportunities that emerge from detailed stories about specific past behavior.

If you’re new to story-based interviewing, it will take time and practice to get good at this. But when we get good at story-based interviewing, we solve the garbage in, garbage out challenge with opportunity mapping.

Opportunity mapping gets easier.

If you’re new to story-based interviewing, it will take time and practice to get good at this. But when we get good at story-based interviewing, we solve the garbage in, garbage out challenge. – Tweet This

Do you want to get better at story-based interviewing?

Our Continuous Interviewing course helps students ask the right questions, guiding the interviewee through their story, step by step, and identifying the opportunities that naturally emerge.

Let’s review. Opportunity mapping requires: one, identifying relevant opportunities, which we’ve done a deep dive on. Two, framing those opportunities properly. And three, uncovering the hidden structure of the opportunity space.

We’ve learned opportunities emerge from customer stories. A well-framed opportunity is specific. It occurs during a specific moment in time. It occurs in a specific context. It’s experienced by a specific customer. These specifics emerge from customers’ stories.

In my next video, we’ll dive into how to uncover the hidden structure of the opportunity space. Don’t miss it. Be sure to subscribe below.

The post Sourcing Opportunities: Unlocking the Power of Opportunity Mapping appeared first on Product Talk.


Sourcing Opportunities: Unlocking the Power of Opportunity Mapping was first posted on February 1, 2023 at 6:00 am.
©2021 "Product Talk". Use of this feed is for personal non-commercial use only. If you are not reading this article in your feed reader, then the site is guilty of copyright infringement. Please contact me at teresa@producttalk.org

Product in Practice: Opportunity Mapping Led to a 20% Lift in LTV at Grailed

What do your customers care about? This seems like a simple enough question, but many product teams struggle to answer it honestly.

Often the first instinct is to frame an answer in terms of what your business cares about. But remember: Your customers don’t care about your business outcomes. They care about having their own problems solved or having an enjoyable experience when they use your product.

Remember: Your customers don’t care about your business outcomes. They care about having their own problems solved or having an enjoyable experience when they use your product. – Tweet This

Today’s Product in Practice is a great reminder of this. One of the product teams at Grailed, a peer-to-peer marketplace for fashion, put a ton of time and resources into building a feed. But instead of launching with great fanfare and adoption, the response was underwhelming.

When the product team took a step back to evaluate what could be better, they realized they could benefit from introducing continuous discovery habits.

Talking to customers regularly allowed them to better frame opportunities in terms their customers actually used. With a better handle on opportunities, it was easier to identify and test assumptions. And the whole process of visualizing their thinking made their work much more enjoyable.

But that’s not all—introducing continuous discovery habits completely transformed their customers’ behavior for the better. And this ultimately had the impact on the business outcomes they cared about most.

Read on to learn about how opportunity mapping led to a major product transformation at Grailed.

Do you have your own Product in Practice story you’d like to share with us? You can submit your story here.

Meet the Continuous Discovery Champions, Rajiv Chopra and DJ Mitchell

Rajiv Chopra is the Group Product Manager and DJ Mitchell is the Staff iOS Engineer on the Discovery team at Grailed. As you’ll see in this blog post, Rajiv and DJ are committed to the values of continuous discovery. But in the context of their company, which is a peer-to-peer marketplace for fashion, “Discovery” refers to helping people discover their style and clothes that could help them express themselves.

Rajiv says, “The real user problem we’re aimed at solving is: ‘I don’t really know what I’m looking for and I need some help—can you help me get inspired and figure it out?’” A small percentage of users—around 10%—arrive at Grailed because they’re looking for a very specific item and it popped up in a search result. But Rajiv says his team is focused on helping the 90% of people who don’t know what they’re looking for to figure it out.

Describing his role, DJ explains that being a staff engineer gives him a lot of latitude to have an impact (and a lot of leeway to define exactly what that means). He sees his role as bringing engineering closer to product, modeling certain types of behavior, and mentoring engineers to be more product minded and outcome oriented.

Before: Claiming to Do Discovery But Struggling to Make an Impact

Rajiv and DJ say that before they introduced the opportunity solution tree and committed to the practice of continuous discovery, their team was struggling with a few common challenges. Rajiv explains, “The PM and leadership would define an outcome based on what we ‘felt’ was important, but it wasn’t really motivated by what we knew or any learnings. And then immediately we’d go into ideating solutions, prioritizing solutions, and then delivering them at full fidelity.”

The Discovery team’s initial approach to building the feed helps illustrate some of these issues. Grailed has both a mobile app and a website, but the mobile app is where they get the majority of their traffic and engagement, so that’s where the team was focused. The original concept of the feed allowed users to curate their experience. Similar to other types of social platforms, users could follow designers or sellers and then browse through content in their feed.

The original premise of this feed, according to Rajiv was: “You set it up, you manage it, curate it, and you allow your feed to represent your style.” The way the Discovery team originally delivered this project was an eight-month investment of building the infrastructure, doing the design work, and building the supporting foundational elements. But when the team got to the end of the eight months, the response was underwhelming. While they didn’t harm the business, they essentially broke even.

This was not the impact they’d been hoping to have, so it prompted Rajiv and DJ to reconsider their approach to product discovery. Around this time, they read Continuous Discovery Habits, which got them thinking about how to apply these concepts at Grailed.

Introducing the Opportunity Solution Tree Leads to Rethinking the Feed

One of the first steps the Discovery team took was to visualize everything that was in their heads through a first draft of an opportunity solution tree. DJ explains, “Our first crack was to do an ideation with the team, just to get everything we think we know. That generated the original version of the opportunity solution tree.” From there, they started talking to users to verify that things were actually true.

Trying to describe this messy process, Rajiv says, “It was basically get everybody together, just dump it out, go through a structuring/affinity mapping/clustering activity, and use that as opportunity solution tree number one.” In that first version, they just had “increase relevance” in the tree.

Since then, their opportunity solution tree has evolved quite a bit. Now the place where the feed lives in the tree is: “I want to browse without any specific idea of what I’m looking for.” Rajiv says, “We want the feed to help accomplish this. That’s the problem this is ultimately trying to solve, and the way that it’s going to do that is helping you browse things that you like that are in your style.”

Describing the evolution of their thinking and the way they framed opportunities, Rajiv explains, “The challenges we were having with the feed were primarily of content quality, which is, ‘I just wish the feed would show me more stuff I like and less stuff that I don’t.’”

And while this might seem obvious, they realized that for several months they were actually solving for the problem, “I wish I could better control what my feed showed me.” At the time, the Discovery team assumed users would curate and manage their own feeds.

But, says Rajiv, “We learned when we talked to users that nobody’s saying this. They don’t say these words. Most people are saying, ‘Show me more stuff I like and less stuff I don’t.’ They’re used to feeds being algorithmic. They’re not thinking about them as, ‘Oh, I need to go and press all these buttons for it to work.’”

We were trying to solve, ‘I wish I could better control what my feed showed me.’ But when we talked to users we learned that nobody’s saying this. They don’t say these words. – Tweet This

DJ compares this evolution to chronological feed debate that’s been happening on every social media platform for the past ten years. “A few people think you want exact perfect control to see everything, but actually the quality of chronological feeds at scale is kind of bad and that’s why no one has them. That’s the same challenge we ran into.”

Looking back on this process, Rajiv says, “We’ve taken a chronological snapshot of our opportunity solution tree over time and you can see how much depth and how certain things get removed and added.” Once they started talking to users about their feeds, they began to pull out opportunities like: “Show me things I interact with” or “Show me stuff that’s popular,” or “There should always be new stuff when I come,” or “I want to get inspired when I come—show me some stuff I don’t already know about.”

Two screenshots of opportunity solution trees. The first one, labeled "Opportunity Tree V1" is very simple with only a few branches of sub-opportunities. The second one, labeled "Opportunity Tree V8" is much more complex, with multiple branches of opportunities and sub-opportunities.

As the Discovery team at Grailed has become more comfortable with continuous discovery, their opportunity solution tree has evolved to be much more complex. Click the image to see a larger version.

The Discovery team started taking these statements and identifying very low-lift ways they could start testing. If users claimed they wanted stuff that was popular, for example, they’d figure out an easy way to introduce that into their feed. “Over the course of six months, the feed went from this very simple, reverse chron feed of everything to a feed that has different parameters, different recommendations, weaves things in an intelligent way, and manages stuff you’ve seen before to make sure that it maintains freshness,” says Rajiv.

A Closer Look at the Transformation of the Opportunity Solution Tree

How did the opportunity solution tree evolve to better guide the transformation of the feed? Rajiv and DJ note that the process of mapping opportunities on the opportunity solution tree involved multiple steps and iterations. It takes time to get it right. “Your understanding of the opportunity space is a slow-moving but constantly growing activity,” says Rajiv. Here are some of their other major observations about the evolution of their opportunity solution tree.

Your understanding of the opportunity space is a slow-moving but constantly growing activity. – Tweet This

“Your understanding of the opportunity space grows and evolves over time,” says Rajiv. “We ended up finding that our initial statements were business statements; they weren’t user opportunities. The most valuable thing is ensuring that our opportunities are representative of words that our customers use. There’s nothing more than just talking to customers to find those opportunities.”

In addition to learning to frame opportunities in the language their customers actually use, Rajiv says they’ve gotten much more specific in their opportunity statements. Before, their opportunities would be framed as, “I want to get inspired and discover without any specific idea of what I’m looking for,” which was such a huge solution space that they had a lot of trouble ideating productively and actually knowing what they were solving for. “Now we’re ideating around a really specific problem, like ‘there should always be new stuff when I come’ or ‘show me stuff that’s popular,’ which has allowed us to get really targeted solutions that directly address the specific problems that people have.”

One other observation Rajiv makes is that the lower you are on the tree, the faster you can be and the higher you are, the more evidence you should be building over time. “And one of the things the opportunity solution tree allows you to do—both by going deep and laddering it back up—is to show that you’re slowly building this lattice of understanding of this problem space.”

One of the things the opportunity solution tree allows you to do—both by going deep and laddering it back up—is to show that you’re slowly building this lattice of understanding of the problem space. – Tweet This

You won’t be able to tell whether a high-level opportunity is important to the business in a week. But within 3 months, you can test your way through 20 opportunities and be in a much better position to say yes, there is strong evidence for it, no, there’s strong evidence against it, or the evidence is mixed and you may need to reevaluate your structure of the problem space. “The way we build this evidence is cumulative—it’s not a zero to one in a week,” says Rajiv.

A Total 180 in Impact: Driving Positive Reception from Users and Real Business Results

There’s no doubt that adopting continuous discovery habits—specifically conducting regular customer interviews and mapping opportunities on the opportunity solution tree—has led to impressive results at Grailed. “It’s had a total 180 in impact, both in terms of business impact and the reception from our users,” says Rajiv.

The two key metrics they cared about were how many items were being discovered from the feed they’ve built and how many dollars of gross merchandise volume (GMV) that was driving for their business.

“Discovery and GMV have grown four to five times from the feed specifically (from January to August),” says Rajiv. “In terms of the impact that it’s having on the business, it’s clearly having a big impact, both in engagement and revenue.”

A graph showing time on the X axis and growth (1x, 2x, 3x, 4x, and 5x) on the Y axis. The lines representing "Discoveries" and "GMV" are both starting around 1x in November 2021 and ending between 4x–5x in July 2022.

The new feed has had a major impact on both how many new items users are discovering and the dollars of gross merchandising volume—two metrics that matter a lot at Grailed.

The Discovery team also wanted to measure the impact of the new feed on lifetime value (LTV) and whether users were changing their behavior in a permanent way. They compared users who made their first purchase through the home feed vs. users who made their first purchase through search. “The feed shows clear evidence that it drives higher LTV, and specifically the way that it does that is it drives higher levels of retention and engagement,” says Rajiv. “When we look at these people who activate through the feed, they come back and open the app about 30% more than the average user, they discover about 40% more than the average user. And the impact that it’s having is to the order of 20% on LTV and specifically by driving higher levels of retention, which is a good proxy that we use for real, true user value.”

Two graphs. The first graph shows the retention rate over time of users who engaged with the feed vs. the baseline. There are more customers who engaged with the feed at every 30-day interval between 30–120 days. The second graph shows cumulative lifetime value (LTV) over time of users who engaged with the feed vs. the baseline. The LTV for the feed was slightly lower than the baseline at 30 days, but higher at every 30-day interval after that.

The new feed has also had a significant impact on user retention and cumulative lifetime value (LTV). Click the image to see a larger version.

The Discovery team is also getting qualitative evidence that the users’ entire perception of the product is changing. Rajiv says, “There were a lot of instances where we wouldn’t even bring up the feed and users would unprompted come to us and say, ‘I gotta tell you. This feed is awesome.’”

This was a major change, Rajiv adds, “I can’t remember the last time at Grailed that we released a feature and without even bringing it up users would come to us and be like, ‘Wow, I’m so stoked that you built that.’ Normally we have to remind them, like, ‘Hey we just released this thing. Do you like it? Did you even notice?’” While the LTV and engagement data provide strong evidence, “It was cool to hear users articulate that same story,” says Rajiv.

Learnings and Key Takeaways

Looking back on their continuous discovery journey so far, DJ and Rajiv have a few key learnings and takeaways to share with other product teams.

  • Read Continuous Discovery Habits!

Reading the Continuous Discovery Habits book is what kick-started this entire journey for the Discovery team at Grailed. It made such a big impression that they started a book club to encourage others to read it and discuss how to apply the concepts on their teams.

  • Map your assumptions and avoid the temptation to jump straight into solutions

“Assumption mapping is also a really valuable tool,” says DJ. “It’s easy to lull yourself into the idea that you don’t need to do any of this stuff and it might seem like extra work when you get it right, but very often you don’t get it right the first time.” DJ emphasizes the importance of following the steps of the opportunity solution tree and not skipping straight to solutions.

It’s easy to lull yourself into the idea that you don’t need to do any of this stuff and it might seem like extra work when you get it right, but very often you don’t get it right the first time. – Tweet This

  • Don’t let the perfect be the enemy of the good.

“You see that in the artifacts of the early opportunity solution trees and how they’ve evolved,” says DJ. It’s really easy to feel confused and feel stuck. Set a time limit for yourself and just keep making progress. But when that fails, move on to the next tip, which is…

  • When in doubt, do it together

“We used to err more on the side of documentation and now we do things much more in person,” explains DJ. “We’ve found it really effective to just do things in person, talk about it, and figure it out together rather than going into a hole and trying to do it all by yourself.”

  • Draw more, talk more, write less

Similarly, drawing (or at least creating a visual representation of ideas) has become the go-to way of communicating at Grailed. “It’s way easier to have a little bit of text and a diagram, a structured visual thing that will explain your thinking. It’s a huge time-saver, but it’s also so much better for clearly expressing what your intention is. It’s a very underrated hack that I’m a diehard believer in now,” says DJ. To facilitate this, they have a section of their InVision board called “scratchpad” where everyone gets a dedicated “visualization corner.”

Drawing is so much better for clearly expressing what your intention is. It’s a very underrated hack that I’m a diehard believer in now. – Tweet This

A collection of virtual whiteboards that include sketches, screenshots, and diagrams. Each one is labeled with a member of the Discovery team—Rajiv, DJ, Brett, and Caroline.

The members of the Grailed Discovery team are now die-hard believers in visualizing their thinking, as evidenced by the scratchpads everyone keeps on their InVision board. Click the image to see a larger version.

  • Your job is to facilitate; not give orders

“I feel like PMs have this existential dread that we’re constantly responsible and accountable for our roadmap,” says Rajiv. “The more you don’t involve your team, the more that gets reinforced. The better I’m doing my job, the less I’m responsible for coming up with ideas and the more I’m responsible for helping the team figure out and discern which ideas to bubble up or dig further into.” By emphasizing facilitation over giving orders, “The quality and quantity of our ideas has gotten much higher. And my emotional wellbeing is so much better than it used to be. Aside from facilitation delivering better outcomes, it makes your job fun and awesome and exciting as opposed to dreadful and oppressive.”

Looking to connect with others who are in the process of introducing continuous discovery habits on their teams? Come join us in the Continuous Discovery Habits community!

The post Product in Practice: Opportunity Mapping Led to a 20% Lift in LTV at Grailed appeared first on Product Talk.


Product in Practice: Opportunity Mapping Led to a 20% Lift in LTV at Grailed was first posted on October 19, 2022 at 6:00 am.
©2021 "Product Talk". Use of this feed is for personal non-commercial use only. If you are not reading this article in your feed reader, then the site is guilty of copyright infringement. Please contact me at teresa@producttalk.org

Product in Practice: When Travel Ground to a Halt, Seera Group Used Opportunity Mapping to Discover a New Market

Hi there, Product Talk readers! We can’t wait to share our latest Product in Practice with you. For this story, we spoke with a product team leading the Digital Hotels vertical at Seera Group, a travel and tourism company based in the Kingdom of Saudi Arabia (KSA). The team shares how they defined a new outcome and mapped out the opportunity space when COVID-19 ground international travel to a halt in 2020 and they were forced to discover a new market. Hope Gurion coached the Seera team using Product Talk’s Continuous Discovery Habits curriculum.

Want to check out the other posts in this series? You can find them here.

The words “travel” and “2020” don’t feel like they belong in the same sentence. Unless, of course, that sentence is, “I had to cancel all my travel plans in 2020.”

In response to the COVID-19 pandemic, beginning in March 2020, many countries closed their borders and some even imposed hefty restrictions on domestic travel.

So you can imagine that a company like Seera and a team like Ahmed Guijou’s—which is focused on helping customers book hotel accommodations—would be facing a major crisis.

How could they adapt to a massive, sudden, and unforeseen obstacle? How could they quickly discover a new market?

We caught up with Ahmed Guijou, Product Director, Ahmed Abdallah, Front End Technical Lead, Eslam Tawakol, UX Designer, Senthil Kumar PG, Product Manager, and Walid Aktouf, UX Lead from the Digital Hotels vertical within Seera to learn more about their story.

A screenshot of a Google Meet with the members of Seera's Hotels product team.

Meet the Seera Hotels product team. Clockwise from top left Ahmed Guijou, Walid Aktouf, Ahmed Abdallah, Eslam Tawakol, and Senthil Kumar PG.

The Challenge: International Travel Instantly Disappears

Before COVID-19, Ahmed Guijou described his team’s purpose as “helping customers book their dream vacation or business trip accommodations in the easiest way possible while helping the company establish itself as a market leader in the region.” The Digital Hotels vertical was an ecommerce platform where Middle Eastern customers could book their business or leisure accommodation locally or internationally. This might include places like hotels, aparthotels, resorts, apartments, or chalets.

But all that changed in the spring of 2020 when Saudi Arabia closed its international borders. “This had a direct impact on our hotel bookings as our primary customers were confined to make domestic bookings,” says Ahmed. “The pandemic also created a fear of meeting people in public places, particularly hotels.”

With the sudden elimination of international travel, Ahmed and his team saw a shift in demand from hotels to alternative accommodations like apartments, chalets, or istiharas. Istihara means “resting place” in Arabic and it’s generally a large property with an outdoor area, barbecue, and a pool.

“From previous rounds of research, we were aware of a culture in Saudi of renting properties on a single-day basis in the same city where they reside,” explains Ahmed. “The purpose of these bookings is to have a large space with an outdoor area and pool to socialize with friends and family, almost like a mini retreat.”

Since the circumstances required focusing almost entirely on domestic sales, Ahmed says, “We had more clarity on supply and demand by city or area in Saudi Arabia. This led us to discover that our supply of alternative accommodations in certain cities was low or nonexistent—particularly in cities that don’t have many hotels, such as Abha and Taif.”

Next, the sourcing team carried out research to identify various means to secure alternative accommodations. They performed market research, which led them to identify a gap in the market.

Mapping out the Opportunity Space to Create a Path Forward

Once the team had narrowed in on a gap in the market, they used opportunity solution trees to map out the opportunity space.

Walid Aktouf explains the process: “We knew upfront that since this is a marketplace, the opportunity space contains two types of customers: guests and hosts. Based on this we needed to create two separate trees, as each customer had different journeys and goals.”

With a marketplace model, the opportunity space contains two types of customers: guests and hosts. This means we needed to create two separate trees, as each customer had different journeys and goals. – Tweet This

A screenshot of an opportunity solution tree labeled "guests"

Here’s an example of the opportunity solution tree the Seera team used for guests. Note that details have been blurred out from all images to protect Seera’s intellectual property.

A screenshot of an opportunity solution tree labeled "hosts"

The Seera team created two opportunity solution trees. This one maps the experience of hosts on their platform.

Walid says that in the early stages of interviewing customers and collecting insights, they added opportunities haphazardly to each tree. “Our thinking was it was too soon to start grouping as no immediate patterns or trends have emerged.”

After conducting at least five interviews with each customer type, the product team started creating parent opportunities based on their perception of the problems. Walid explains, “At this point, the parent groups were simply labels like Content, Payment, Trust, and Miscellaneous and not higher level opportunities.”

The more interviews the team conducted, the easier it was to identify clear overarching opportunities. Walid says, “As a result, we reframed the parent labels into actual opportunities and reshuffled our tree. We narrowed it down to five high-level opportunities, like ‘I wish to have a smooth transaction,’ with multiple child levels like ‘I want hassle-free payment’ and ‘I wish I could pay on arrival.’ As you go down the tree, the opportunities become more specific.”

When we started mapping opportunities, our parent groups were simply labels. As we conducted more interviews, we reframed the parent labels and reshuffled the tree. – Tweet This

Walid stands smiling in front of a whiteboard with a list of opportunities written out, such as "I need an apartment when traveling with my friends" and "I need accommodations, to ask questions, and find out about budget."

Walid shares some of the opportunities his team landed on after conducting several rounds of interviews with guests and hosts.

Synthesizing Learning with Visual Representation

One of the major benefits of using the opportunity solution tree? Walid says, “The tree served as a visual representation of all the insights and opportunities we were collecting from customers. This allowed us to organize learnings by hierarchy, by theme, or by size—for example, how frequently customers mentioned something.”

The opportunity solution tree served as a visual representation of all the insights and opportunities we were collecting from customers. – Tweet This

A zoomed out view of several Miro boards, labeled things like "opportunity solution trees," "story maps – assumptions," and "research insights."

This zoomed out Miro board shows the various ways the Seera team used visual artifacts like the opportunity solution tree to track their progress and communicate with stakeholders.

Ahmed Abdallah says the tree evolved along with the team’s understanding of the opportunity space: “The trees served as a way for us to incrementally shape our understanding of guests and hosts. Our tree was almost a reflection of our understanding of the opportunity space—as our understanding grows or changes, so does the tree.”

Our opportunity solution tree was almost a reflection of our understanding of the opportunity space—as our understanding grows or changes, so does the tree. – Tweet This

The team also used color to highlight the more valuable opportunities which they planned to explore first. Walid explains that they kept track of how often customers mentioned specific opportunities. They then posed the question, “If we solve this opportunity, how big of an impact will it have on customers?”

Using the answer to that question, they would center subsequent interviews around these opportunities to get a clearer understanding of how they would affect the customers’ overall experience. “This helped us assess and size the opportunities with more confidence,” says Walid.

Ahmed Abdallah says the tree was especially helpful because it helped them better understand the differences between booking a traditional hotel and alternative accommodation like an istihara. “As we conducted more and more interviews, we noticed patterns in their journey that don’t apply to hotel customers. For example, when booking istirahas, customers don’t spend the night. They book it from afternoon to midnight and spend the day at the property socializing and having a good time with family and friends. Hotel customers, on the other hand, primarily need a clean and comfortable place to spend the night—not a place to socialize and have fun. This was one of the biggest contrasts we found, among many.”

Summing up the benefits of using the tree to map opportunities, Walid says, “The tree made it easy to record, absorb, and even share our findings. By using trees, we made sure we didn’t lose record of any opportunities.”

The tree made it easy to record, absorb, and even share our findings. By using trees, we made sure we didn’t lose record of any opportunities. – Tweet This

Using the Tree to Guide Their Next Steps

The product team continued using the opportunity solution tree to guide their next steps in the discovery process. Eslam Tawakol explains that after identifying the most promising opportunities based on customer interviews, “We reframed these key opportunities we identified into themes that served as criteria for our competitive analysis. We analyzed our competitors on their experience, journeys, and business model and mapped it all in a Miro board.” Using the information they gathered, they created a matrix to score competitors on a scale of 1 (poor solution) to 5 (excellent solution).

A table with the column headers "Customer," "Business," "Market," and "Total." Each row has a blurred out opportunity and each cell has a number based on the team's evaluation of that opportunity.

The Seera product team used opportunities to help them run competitive analysis. They created this matrix to score competitors on a scale of 1 to 5.

The team returns to the tree on an ongoing basis to help them prioritize. Senthil Kumar PG says, “Our tree helps us focus on the most impactful opportunities. Everything on the tree is up to date and based on learnings from actual discussions with customers. This ensures our decisions are both relevant and evidence-based.” Senthil says the product team considers the tree to be a sort of “dashboard” where they can find the most relevant information at a glance.

Everything on the tree is up to date and based on learnings from actual discussions with customers. This ensures our decisions are both relevant and evidence-based. – Tweet This

Plus, the tree keeps everyone grounded in the same data points and means decision-making is a team effort. Senthil says, “Making decisions based on our tree is collaborative—everyone has a voice. It’s the starting point for most team conversations, and it guarantees that our discussions and negotiations revolve around facts and evidence, not our own opinions.”

Making decisions based on our tree is collaborative—everyone has a voice. It also guarantees that our discussions and negotiations revolve around facts and evidence, not our own opinions. – Tweet This

As a visual tool, the opportunity solution tree doesn’t just help the product team at Seera—it’s also an ideal way to keep stakeholders in the loop. This did require some slight changes so stakeholders wouldn’t get bogged down in the details. Ahmed Guijou says, “We reframed high-level opportunities into themes or customer needs, in a way that our stakeholders can better relate to. They didn’t need to know every little detail, so we created a shortlist of the most impactful and eye-opening opportunities to share with our stakeholders.”

During weekly checkpoints with stakeholders and management, the team would share new insights and highlight any concerns or risky assumptions they hadn’t yet tested. “We didn’t need to prepare any slides or formally present our progress,” says Guijou. “Instead, we gave them walkthroughs directly on our Miro boards. This informal approach enabled us to have an open discussion where stakeholders could share their input at any time, as opposed to a one-way presentation. Our approach with stakeholders was: ‘Here are our findings. This was our approach. Here is our next move. What do you think?’”


A zoomed out view of a Miro board that includes assumptions on a matrix.

The product team used their opportunity solution tree to keep track of assumptions and get input from stakeholders.

Reflecting on Their Challenges and Successes

As you might expect, the product team at Seera encountered a few obstacles and challenges when adopting opportunity solution trees and continuous discovery. Walid says recruiting hosts to interview was a hurdle initially and continues to be. “It gives us an early indication or warning that getting them to sign up to our platform will be even more challenging.”

Sizing opportunities was also challenging, Walid says, “As we were exploring a new product space, we didn’t have any existing data or numbers to help us size opportunities. However, the more we talked to customers, the more knowledge we gained. This gave us confidence that the opportunities we picked were the right ones.”

The more we talked to customers, the more knowledge we gained. This gave us confidence that the opportunities we picked were the right ones. – Tweet This

Walid cites the very nature of their project—understanding an entirely new product—as another challenge: “We were not trying to optimize anything, but rather find a product-market for an entirely new product. So we needed to address more than one opportunity to be able to create an MVP. Deciding which ones to validate and solve for first was difficult.”

But the team experienced some bright spots, too. They were lucky to have supportive management from the get-go, says Walid: “They gave us the room to properly explore the opportunity space. They also gave us whatever tools, resources, or other requests we needed.”

And it wasn’t just the management who contributed to their success. Walid says, “Engineers were super proactive as they were involved every step of the way. They created comprehensive prototypes with no requirements or briefs. Their invaluable contribution helped us quickly and effectively test with customers.”

And reflecting on the continuous discovery process as a whole, Walid can’t help but share his enthusiasm. “This process helped us innovate. We’re not copying competitors or creating something that already exists. We’re focusing on real customer problems that are yet to be solved or addressed in the market. We have early indications that we are about to provide real value to both our customer types, and it’s really exciting.”

Key Takeaways for Other Teams

Reflecting on the product team’s experience so far, Ahmed Guijou distills their learnings into a few key points.

  • Never get complacent when it comes to interviewing customers

“No matter how repetitive the insights get, it’s important to keep your customers within arm’s reach—and there’s no better way to do this than by talking to them on a regular basis,” says Guijou. “If our insights got repetitive, we simply shifted our interview focus. There are always things we can learn more from our customers.”

No matter how repetitive the insights get, it’s important to keep your customers within arm’s reach—and there’s no better way to do this than by talking to them on a regular basis. – Tweet This

  • Make sure the whole team is comfortable interviewing customers

Guijou stresses the importance of having everyone—whether product managers, designers, or engineers—get comfortable talking to customers. “It’s a lot more powerful when you talk to customers directly, as opposed to listening in on the conversation.”

It’s a lot more powerful when you talk to customers directly, as opposed to listening in on the conversation. – Tweet This

  • Use interview snapshots religiously

Be sure to take notes during interviews in a format that others can easily understand. Guijou says his team took notes in real-time directly on the snapshot document and made sure to debrief soon after the interview to extract opportunities while the conversation was still fresh in their minds.

  • Don’t be afraid to tear your trees down and build them again

“We had over ten different iterations on our tree,” says Guijou. He explains that after rounds of interviews, customer insights led them to identify different ways of looking at things and reshuffle the whole tree. “Changing direction is not a bad thing. Think of it as correcting instead of changing course. Always remain flexible, as new findings can emerge that might shift your focus.”

Changing direction is not a bad thing. Think of it as correcting instead of changing course. Always remain flexible, as new findings can emerge that might shift your focus. – Tweet This

  • Every team member has a voice

The opportunity solution tree makes it easy to collaborate both within and outside the product team. “We loved dot-voting,” says Guijou. “It’s a fun and fair way for the team to make decisions quickly, and have an open discussion afterwards.”

2020 has taught us that we can’t anticipate the massive global changes that can transform our industry instantaneously. But we can develop skills and tools that will help us adapt to these unanticipated changes. The Seera product team’s story shows us how the opportunity solution tree can help teams quickly change course, evaluate new opportunities, and emerge with confidence in their new direction.

Reflecting on her experience with the Seera team, Hope says, “Working with the team as they evolved their approach to identify market needs, customer needs, and where to begin to prove that they were on the right track was so rewarding. They embraced the practices and were never discouraged—even when it was messy and they had to restructure their thinking. I know this journey will inspire other teams eager to experience the same purpose in their work by using continuous discovery methods and having supportive leaders who get why this is critical to success.”

Do you have a story about adopting continuous discovery at your company? Get in touch to let us know, and we may end up featuring your story in a future Product Talk post.

The post Product in Practice: When Travel Ground to a Halt, Seera Group Used Opportunity Mapping to Discover a New Market appeared first on Product Talk.

Opportunity Mapping: An Essential Skill for Driving Product Outcomes

The following is an excerpt from my upcoming book, Continuous Discovery Habits. It’s the opening to my chapter on Opportunity Mapping. Read to the end for an exciting new announcement.

“To maintain the state of doubt and to carry on systematic and protracted inquiry—these are the essentials of thinking.” John Dewey, How We Think

“Structure is complicated. It gets done, undone, and redone.” – Barbara Tversky, Mind in Motion

As you collect customers’ stories, you are going to hear about countless needs, pain points, and desires.

Our customers’ stories are rife with gaps between what they expect and how the world works. Each gap represents an opportunity to serve your customer.

However, it’s easy to get overwhelmed knowing where to start. Even if you worked tirelessly addressing opportunity after opportunity for the rest of your career, you would never fully satisfy your customers’ desires.

This is why digital products are never complete.

How do we decide which opportunities are more important than others? How do we know which should be addressed now and which can be pushed to tomorrow?

It’s hard to answer either of these questions if we don’t first take an inventory of the opportunity space.

A single customer story might elicit dozens of opportunities. If you interview continuously, your opportunity space will always be evolving—expanding as you learn about new needs, contracting as you address known problems, and gaining clarity as you learn more about specific needs.

Managing the opportunity space is a critical activity. Finding the best path to your desired outcome is an ill-structured problem and requires that we first structure or frame the problem space before we can dive into solving it.

Mapping the opportunity space is how we give structure to the ill-structured problem of reaching our desired outcome.

Mapping the opportunity space is how we give structure to the ill-structured problem of reaching our desired outcome. – Tweet This

It’s easy, however, to bounce from one opportunity to the next—reacting to each and every need or pain point we hear about. Most product teams are devoted to serving their customers and when they hear about a need or a pain point, they want to solve it.

But our job is not to address every customer opportunity. Our job is to address customer opportunities that drive our desired outcome. This is how we create value for our business while creating value for our customers. Limiting our work to only the opportunities that might drive our desired outcome is what ensures that our products are viable over the long run and not just desirable in the moment.

Our job is not to address every customer opportunity. Our job is to address customer opportunities that drive our desired outcome. – Tweet This

Our goal should be to address the customer opportunities that will have the biggest impact on our outcome first. To do this, we need to start by taking an inventory of the possibilities.

In the quote that opens this blog post, American educational philosopher John Dewey encourages us to “carry on systematic and protracted inquiry.” Rather than jumping to the first need that we might address, Dewey argues, good thinking requires that we explore our options—that we carry out a systematic search for longer than we feel comfortable.

We should compare and contrast the impact of addressing one opportunity against the impact of addressing another opportunity. We want to be deliberate and systematic in our search for the highest impact opportunity.

In the second quote that opens this post, cognitive psychologist Barbara Tversky reminds us that structure “gets done, undone, and redone.”

As the opportunity space grows and evolves, we’ll have to give structure to it again and again. As we continue to learn from our customers, we’ll reframe known opportunities to better match what we are hearing.

As the opportunity space grows and evolves, we’ll have to give structure to it again and again. – Tweet This

As we better understand how our customers think about their world, we’ll move opportunities from one branch of the opportunity solution tree to another (more on that later). We’ll rephrase opportunities that aren’t specific enough. We’ll group similar opportunities together. These tasks will require rigorous critical thinking, but the effort will help to ensure that we are always addressing the most impactful opportunity.

In this post, we’ll tackle the challenges with managing opportunities in a backlog, why tree structures are better for managing the complexity of the opportunity space, and how you can level up your opportunity mapping skills.

Taming Opportunity Backlogs

Some teams are already capturing opportunities in an opportunity backlog. They prioritize their list of customer needs, pain points, and desires the same way they prioritize their user stories in their development backlog.

This is a great place to start. It’s better than only working with one opportunity at a time.

However, it can be hard to prioritize a flat list of opportunities, because opportunities come in different shapes and sizes, some are interrelated, others are subsets of others.

It can be hard to prioritize a flat list of opportunities, because opportunities come in different shapes and sizes, some are interrelated, others are subsets of others. – Tweet This

For example, imagine you work at a streaming entertainment company and are working with the following list of opportunities:

  • I can’t find something to watch.
  • I’m out of episodes of my favorite show.
  • I can’t figure out how to search for a specific show.
  • I don’t know when a new season is available.
  • The show I was watching is no longer available.
  • I fell asleep and several episodes kept playing.
  • I want to watch my shows on my flight.
  • I want to skip the show intro.
  • Is this show any good?
  • I want to know what my friends are watching.
  • Who is that actor?
  • I want to watch my shows on my train commute.

I don’t know how to compare “I can’t find something to watch” with “I’m out of episodes of my favorite show.” These opportunities are not distinct. Running out of episodes of your favorite show is a reason why you might not have something to watch. But it’s not the only reason, so these aren’t exactly the same either.

“I want to watch my shows on my flight” and “I want to watch on my train commute” sound similar. Are these really the same opportunity? Maybe they can be combined into, “I want to watch on the go.” That might be right.

Unless planes and trains introduce different constraints. I may need to be completely offline on a plane, whereas on a train I may still have cell data. I might have access to a power outlet on a plane, but not on a train. If these context differences are important to the experience, these opportunities are similar, but not the same. But how do I prioritize them against each other? Can I address them both at the same time?

“Is this show any good?” feels like a big, hard problem. How do we evaluate “good” for each individual viewer?

“Who is that actor?” feels much easier. Should we always prioritize easy over hard? If so, when do we ever get to the hard problems that have the potential to differentiate us from our competitors and really drive our outcomes?

It’s hard to answer these questions when prioritizing opportunities of different shapes and sizes against each other. The opportunity space is too complex to manage as a flat list. Let’s turn to a better alternative.

The Power of Trees

A graphic that depicts an opportunity solution tree—a tree structure with a desired outcome at the root, several branches of opportunities, with solutions and experiments as the leaf nodes.

Opportunity solution trees help us map out the complexity of the opportunity space.

Instead of managing an opportunity backlog, we’ll use an opportunity solution tree to help us map out and understand the opportunity space. The tree structure will help us visualize and understand the complexity of the opportunity space.

Trees depict two key relationships—parent-child relationships and sibling relationships. Both will help us make sense of the messy opportunity space.

Trees depict two key relationships—parent-child relationships and sibling relationships. Both will help us make sense of the messy opportunity space. – Tweet This

The parent-child relationship will be used to represent subsets—a child opportunity (or sub-opportunity) is a subset of a parent opportunity. For example, in the previous section, we saw that “I’m out of episodes of my favorite show” was one reason, but not the only reason for “I can’t find anything to watch.”

Referring to the tree relationships, we would say that “I can’t find anything to watch” is the parent of the child “I’m out of episodes of my favorite show.”

A mini-tree diagram with "I can't find anything to watch as the parent and "I'm out of episodes of my favorite show" as a child, with two unidentified siblings.

We might then ask, “What are other reasons why I can’t find anything to watch?”

A mini-tree diagram with "I can't find anything to watch" as the parent and "I'm out of episodes of my favorite show", "I can't figure out how to search for a specific show", and "The show I was watching is no longer available" as children.

We might add, “I can’t figure out how to search for a specific show” and “The show I was watching is no longer available” as siblings to “I’m out of episodes of my favorite show.”

Siblings should be similar to each other—they are each a subset of the same parent, but distinct—you can address one without addressing another. For example, we can address “I can’t figure out how to search for a specific show” without addressing “I’m out of episodes of my favorite show.” But by addressing “I can’t figure out how to search for a specific show,” we partially address “I can’t find anything to watch.”

Sibling relationships help us make sense of similar opportunities like “I want to watch my shows on my flight” and “I want to watch my shows on my train commute.”

We can easily depict both on our tree under the parent opportunity “I want to watch my shows on the go.” This allows us to treat each context (e.g. plane, train) as a specific need to address, while also visualizing the similarities. They are both sub-opportunities of the same parent.

When we learn to think in the structure of trees, it helps us decompose large, intractable problems into a series of smaller, more solvable problems.

A mini-tree diagram with "Is this show any good?" as the parent and "What type of show is this?", "Who is in this show?", "Is this show similar to another show I've watched?", and "Who else is watching this show?" as children.

For example, “Is this show any good?” might on the surface look like a challenging problem to solve. But as we dig in and learn more, we realize that different people solve this problem in different ways.

Some people choose what to watch based on the type of show (i.e. they like dramas or crime shows). Others choose shows based on who is in it—they have favorite actors—and they use the cast list as their primary selection factor.

The more we learn about how people evaluate shows today, the more likely we can turn a big, intractable problem like “Is this show any good?” into a series of more solvable problems: “What type of show is this?”, “Who is in this show?”, “Is this show similar to another show I’ve watched?”, “Who else is watching this show?”, and so on.

The big, intractable problem of “Is this show any good?” is a parent opportunity while the rest are its sub-opportunities (or children).

The value of breaking big opportunities into a series of smaller opportunities is twofold. First, it allows us to tackle problems that otherwise might seem insolvable. And second, it allows us to deliver value over time.

That second benefit is at the heart of the Agile manifesto and is a key tenet of continuous improvement.

Rather than waiting until we can solve the bigger problem—“Is this show any good?”—we can deliver value iteratively over time.

We might start by solving the smaller problem of “Who is in this show?” because it’s fairly easy to solve and because we know a large percentage of our audience chooses shows according to this criteria.

This allows us to ship value quickly.

Now it might not solve the bigger opportunity completely, but it does solve a smaller need completely.

Once we have accomplished that, we can move on to the next small opportunity. Over time, as we continuously ship value, we’ll chip away at the larger opportunity. Eventually, we’ll have solved enough of the smaller opportunities that we will in turn have solved the larger opportunity.

Additionally, the tree structure is going to be invaluable when it comes time to assessing and prioritizing opportunities.

Our goal is to work on the most impactful opportunity, but we can’t assess every opportunity we come across. We’d spend weeks assessing the opportunity space instead of shipping value to our customers.

Our goal is to work on the most impactful opportunity, but we can’t assess every opportunity we come across. We’d spend weeks assessing the opportunity space instead of shipping value to our customers. – Tweet This

Instead, we can use the tree structure to help us make fast decisions.

While structuring the opportunity space is hard work, the effort is paid back with hefty rewards.

Announcing a New Course: Opportunity Mapping

I’m excited to announce we are adding a new course to our collection at Product Talk Academy.

Some of the most common questions I get are: “How do we synthesize what we are learning across our customer interviews?” and “How do we know which customer needs, pain points, and desires to address?”

This course was designed to answer those questions.

In this four-week course, you’ll learn how to:

  • synthesize what you are learning across customer interviews—finding patterns amongst unique stories.
  • identify unmet customer needs, pain points, and desires helping you decipher where your product can have the biggest impact.
  • structure the opportunity space—helping you turn large, intractable challenges into a series of smaller, more solvable challenges.
  • assess and prioritize opportunities quickly, ensuring that you are always working on the highest impact needs.

And, most importantly, you’ll get a minimum of four hours of deliberate practice (more if you want it) to hone your skill.

I’d love to have you join the first cohort. Learn more here.

The post Opportunity Mapping: An Essential Skill for Driving Product Outcomes appeared first on Product Talk.

Product in Practice: How One Product Manager Innovates in Big Companies

One of my goals at Product Talk is to showcase what good product management looks like. Today, I’m excited to introduce a new series, Product in Practice, where I’ll profile product managers doing great work.

To kick off the series, we interviewed Rachel Allen, Director of Product at Omnitracs.

I met Rachel when she was a product manager at Arity (an Allstate company). At Arity, Rachel built out a shared mobility business line from scratch. You’ll see as Rachel tells her story that one of her superpowers is launching new business lines within large companies.

I want to share Rachel’s story because too often I hear from product managers about all the things that won’t work at their company. As you read, notice how Rachel uses her company’s context as an advantage. She has a relentless focus on finding good markets, a strong sense of urgency to ship a product, and the track record to show that her process works.

I hope you enjoy this interview as much as I did. I also want to thank Melissa Suzuno, my blog editor, for conducting this interview.

A headshot of Rachel Allen

Rachel Allen loves how product management gives her the ability to be involved in every aspect of the business.

Tell us a little about your background. How did you first learn about product management and how did you decide to pursue it?

I had no idea what a product manager was when I met the woman who managed a portfolio of products at one of my former employers, HERE Maps. I was there to present my findings on how one of our business lines was doing.

At the time, I was a Lead Business Analyst. After sharing how I thought the business could improve based on the market situation, customer feedback, and some new ideas that leveraged our core technologies, she looked at me and said: “What are you doing? You are a product manager.” A few weeks later, she offered me a job on her team.

At the time, you couldn’t really find much about product management online. So, unlike my former role where I focused on writing system requirements, I just started doing whatever I thought the business needed. If my product needed a better value proposition, I worked with customers to invent it and finance to determine how much new value we could capture. If it meant doing something different, I worked with engineering to design it. If I broke the rules, I’d work with legal to sort things out.

As product management became more popular, I’d like to say that I went out and read everything that was out there about it, but I didn’t. Instead, I just kept my focus on the market, learning as much as I could about the problems I was trying to solve—I’d let myself get frustrated with them.

I kept meeting with every team in the company to learn more about what my business was good at, even if it didn’t involve direct contact with the products that I was building. I kept meeting with people that could mentor me to think differently. And that’s still how I operate today.

I guess you can say that although I have learned a lot from others, I still haven’t learned much about product management itself, even if my title says that is who I am. What I have learned though is that product management gives me the flexibility to get involved in every aspect of the business, and I can use what I learn about it to invent new possibilities. So, I keep pursuing product management for that reason.

Product management gives me the flexibility to get involved in every aspect of the business, and I can use what I learn about it to invent new possibilities. – Tweet This

What type of work are you doing now?

I work with people to deliver transformational products, but there’s a dirty secret to it. People don’t just do what you ask them to because it makes sense to do it and the market doesn’t just take your product because it solves their problems.

When I was at HERE Maps, working with various teams to implement things, they didn’t just “do it.” They didn’t just “do it” when I moved on to Conversant, and they didn’t just “do it” when I moved on to Arity. As a Director of Product at Omnitracs, I can tell you with full confidence, people won’t just “do it” here either.

It’s the same for the market. Customers don’t just adopt. So, the work I do—and have been doing for most of my career—is about taking in gobs of information, synthesizing it, forming a point of view, and getting people excited to make the point of view better based on what they know.

Product management is about taking in gobs of information, synthesizing it, forming a point of view, and getting people excited to make the point of view better based on what they know. – Tweet This

My teams move markets. It’s hard to do that. So, what work am I doing now? I’m selling. I’m listening. I’m selling. I’m researching. I’m selling. I’m challenging. I’m selling. I’m pushing. I’m selling. I’m partying. I’m selling. I’m pivoting. I’m selling.

What does your product practice look like today?

My focus is on new to market product management. What that means is that I work on extracting value from an enterprise to create new value. I look at the core assets in a company and see if we can either extend them into new markets or create totally new products with those assets. And, within that domain, I’ve started to specialize in mobility and transportation-related things.

A screenshot of Arity's Shared Mobility product page.

At Arity, Rachel took a predictive model that had been used to model risk for car insurance and transformed it to help shared mobility platforms determine the risk of renting their vehicles to new drivers.

For example, since my former employer Arity was founded by Allstate, I took a predictive model that was historically used for understanding risk in order to price car insurance and I worked with my team to transform it into a model that helped shared mobility platforms decide if they wanted to take on the risk to rent their vehicles to new drivers.

I’ve really found it powerful to repurpose massive assets—you usually get a unique advantage to drive your product ahead. Larger companies have more experience and great assets to train predictive models. They make it possible to spin up something robust and they have the power to launch the product to a wide, trusting, customer base.

Since I typically work on projects that involve figuring out how to improve mobility or how to better transport goods to improve our economy, the crux of it all falls back on using location data, creating new predictive models, and designing experiences for people to communicate better with machines.

It’s kinda trippy to watch how machines are really changing the way we live. My product practice involves a deep sense of learning about what machines can do, breaking them up, and figuring out how they can do it better for people who want to move around and consume goods at the click of a button.

Can you walk us through how a recent product release came to fruition?

I start by understanding what our business objectives are. If we need to create short-term revenue, I’ll take one approach. If we need to create long-term revenue, I’ll probably take a very different approach.

A graph with "value" along the vertical axis and "time" across the horizontal axis. Horizons 1, 2, and 3 each represent further points in time and greater value.

McKinsey’s 3 Horizons model provides a useful framework for anticipating future business needs.

I typically work in more Horizon 2, Horizon 3 types of worlds. Based on the definition from McKinsey and popularized in the book, The Alchemy of Growth, “Horizon 2 ideas extend a company’s existing business model and core capabilities to new customers, markets, or targets. Horizon 3 is the creation of new capabilities and new business to take advantage of or respond to disruptive opportunities or to counter disruption.”

The objectives I’m working on are usually more long-term revenue. In those cases, I do a lot of market research to understand upcoming trends, new technologies, and potential problems in a future market.

These problems may not necessarily be manifesting themselves today or they may not be problems that real potential customers are actually experiencing just yet, but they’re a hint of a problem to arise.

Rachel sits at a table with her laptop and printed out report, which she's reading and making notes on.

Research is a significant part of Rachel’s job.

I’ll ideate on potential solutions. I focus on understanding how big the problem could be and how much of a problem it actually will be for a market we’re about to target or a market we want to target. And then I just marry that up with the core capabilities of the organization and see if there’s a fit.

It’s really about research and ideation, about being engulfed in the market—reading everything about it, talking to everyone who has a role in the ecosystem, bringing in other players in the market to help you define your point of view, and not being scared to have a strong point of view with a vision.

Do you generally do the research on your own or have others who are participating with you?

I always start it on my own, and then work with experts to dive into specific areas. It depends on the resources that are available within the organization—but typically I work with UX, design researchers, a competitive intelligence team, data scientists, engineers, marketing, and sales.

How do you know that something is the right direction if you’re working off of future anticipated needs?

There are always small market signals. When I was at HERE Maps before there were many bike lanes on the road, there were some cities that had bike lanes and we saw some bicyclists but it was nothing like what we see today with the Divvy bikes or Jump bikes—it was personally owned, commuter-based biking.

A screenshot of the HERE Maps website.

Anticipating the explosion of bike-sharing services, Rachel decided to develop bike lanes on maps while working at HERE Maps.

Very early on, I wondered what it would be like when new cyclists hit the road. I started reading about how cities wanted to build bike lanes to develop a better eco-footprint and encourage biking, but they hadn’t actually built them yet.

So, I just assumed that there would be a problem navigating roads for bikers who wanted to take advantage of the new infrastructure.

There were signals of this problem early on, but at the time most people weren’t renting bikes to go to new places, so they didn’t really need to know the routes.

HERE Maps worked with a ton of car manufacturers, so I asked our sales team if I could sit in on a meeting to chat with the customers about the roads. It turned out they had a fear of bike lanes causing accidents for their drivers, who would also have to adjust to the upcoming trends.

They really understood that as cities started to develop more bike lanes and as bikes became a shareable asset, there would not only be this problem of understanding how to get to new places on bicycles using bike lanes, there would also be a safety concern.

Although I originally thought the product should start by going direct to consumers, I learned that there was another market that may find value from the products as well, and that value was arguably greater. It was fairly easy to monetize the value since I could make it an up-sell to the organization’s current offering by adding an extra layer on top of a core map that provided vehicle navigation. So, I started developing bike lanes on a map.

So you start with the research, try to identify potential needs, and once you’ve gathered enough information, do you try to get internal stakeholders bought in or are you trying to get potential customers on board?

It doesn’t really operate in a sequence—it operates in parallel. But the most important thing is about building the business case.

I’m trying to see how big the opportunity could be—how much is it worth to the organization? How much could we actually make by solving it?

The most important thing in product management is about building the business case. I’m trying to see how big the opportunity could be—how much is it worth to the organization? – Tweet This

And then it takes very little to validate it externally in the market. Sometimes you don’t need to believe what potential customers say. I’ve had so many situations where customers say, “No, that’s not something we need.” And then we build it, it’s in the market, they need it, and it’s the most important thing once time passes.

There are always early adopters in the market—the forward-thinking risk takers. They are the ones you need a “yes” from and there’s usually very few of them.

But they are forgiving of product weaknesses. They will help you refine things. They will help you get the product ready for mainstream, while other players in the market catch their business up. And by the time the other businesses catch up, you’ll have a success story with the early adopters.

Launching a product isn’t the only responsibility of a well-rounded product manager. They need to be responsible for the product’s growth. And, many times, this is assisted by promoting success stories.

Launching a product isn’t the only responsibility of a well-rounded product manager. They need to be responsible for the product’s growth. – Tweet This

Success stories allow businesses to take risks when they are ready for them. These stories allow you to change the market’s perception instead of forcing you to follow it. And that requires glazing over most customer feedback.

All this being said, this strategy can’t and won’t work if the market you’re building a product for isn’t new and you aren’t betting on its growth. Only hearing “yes” from one to two customers should give you enough confidence when there is no popular voice to hear “yes” from yet, if you’ve done thorough research to know that one day there will be a large market and a voice in it… and you want to have first dibs on shaping it.

Only hearing ‘yes’ from one to two customers should give you enough confidence if you’ve done thorough research to know that one day there will be a large market. – Tweet This

And what are you doing to get internal stakeholders bought in to what you’re doing?

It’s all about great pitch decks that create a story—one with zoomed out state of the market that then goes deep into a problem (a reason why something isn’t working) and ends with a hero (the company’s solution).

And it always has numbers to show how big the market is that is having the problem, how big the problem is for the market, how much money the company can make by solving it, and how much it’s going to cost to solve it.

I’m not terribly methodical, but this is one thing that I always do. And then I just start shopping it around. You need everyone on board: your leadership, your team, teams that won’t be directly helping you to build things… absolutely everyone. Everyone will help drive the story to the ending at one point, so it’s important for them to want to drive it to the ending that you envision.

Can you share a time when this went well? Maybe a time when it didn’t go so well?

I did it really well when I was pitching to create a product that helps shared mobility operators predict the risk of new drivers before they let them rent a vehicle or drive around passengers for rideshare.

I gave the hero story and people really wanted to be part of the solution. It became a company goal and everyone clearly understood it.

Folks from procurement rallied to negotiate pricing with a third-party vendor that we used. When we pitched it to a few customers and they wouldn’t take it right away, sales kept pushing through objections. They could have given up, but they believed in it. Everyone in the organization fought for it from different angles and it was beautiful. People started using the product name as verb.

Then there was another time in a previous role that I didn’t really do my pitch well. I believed in the product so damn much and I was so excited about it that I didn’t have the patience to discuss it with everyone.

I talked about it with my team but I guess I thought the value was so obvious, everyone else would just understand. But, they didn’t. So, they tried to kill it—three times. And they did. Twice.

By the third time I was so gung-ho about this thing that I doubled down on my story. I got all the facts on paper, listing every single customer testimonial I could get (and by this time, we actually had plenty). I showed how our competitor was starting to do the thing. Now it’s being built… again… but later to the market than I hoped, and missing opportunities to learn. And this was my fault.

Let’s say that you’ve done the pitch and you’ve gotten people bought in to the idea. What happens next?

Then it’s all about staffing it up. If you make the right business case, it doesn’t only include how much revenue you’re able to obtain, it also includes how many resources and the type of resources you need to build the product. So then it becomes about building the team that can actually start delivering the product.

The right business case isn’t just about how much revenue you’ll obtain but also which resources you’ll need to build the product. – Tweet This

Have there been situations when you realized along the way that your hypothesis didn’t hold up?

When you make the hypothesis and come up with the big idea, it’s not refined. It doesn’t have any sort of detail in it about the product. It’s not really about the product; it’s more about the business case.

For all intents and purposes, you could call the product “Thing X.” Once you actually start developing it, it takes on a form that you might not have imagined at all in the initial phases.
It’s always growing and evolving and that comes from taking so many different perspectives from the organization and really listening to people to leverage their expertise.

When you start leveraging the experts, that’s when you really start to understand what the true product is. In the early stages you’re never really talking about a product; you’re talking about a line of business.

When you start leveraging the experts, that’s when you really start to understand what the true product is. – Tweet This

Tell us a bit more about this process of leveraging expertise from others in your organization.

You’ll have a bunch of different conversations with people. For example, for a model that predicts the risk of a driver before they enter a platform, I knew we needed something.

Working with UX, they said, “Here are the people in an organization that care about predicting risk in advance and they would want to see these kind of analytics but they won’t manually make decisions,” so that drove the product to be refined by understanding who was going to be using it day to day.

Working with data scientists, we understood all the variables that were required for that product, which made us customize it in a certain way to make it competitive.

In working with our legal team, we saw that we had this unique advantage where we were able to partner with a third party and leverage the enterprise discount, so we could reduce the price and still provide as much value.

Any conversation you have shifts the product in one direction or another—in a good way.

Any conversation you have with internal experts shifts the product in one direction or another—in a good way. – Tweet This

Is there any danger of not being able to decide because there are always more people you can talk to or more information you can gather? How do you know when it’s time to move?

You move right away. You move the moment you have people assigned—you just start and then you let it mold.

It’s like building a clay sculpture. The moment you have the clay, you start working with it, and with each new thing that you learn, you might extend it one way or the other, and it’s warm so you can do that, but you don’t ever wait. Ever. Or else your clay will harden as a completely useless blob.

The post Product in Practice: How One Product Manager Innovates in Big Companies appeared first on Product Talk.